Immigrants from Egypt vs Cree College, 1 year or more
COMPARE
Immigrants from Egypt
Cree
College, 1 year or more
College, 1 year or more Comparison
Immigrants from Egypt
Cree
62.4%
COLLEGE, 1 YEAR OR MORE
97.8/ 100
METRIC RATING
92nd/ 347
METRIC RANK
56.8%
COLLEGE, 1 YEAR OR MORE
3.6/ 100
METRIC RATING
229th/ 347
METRIC RANK
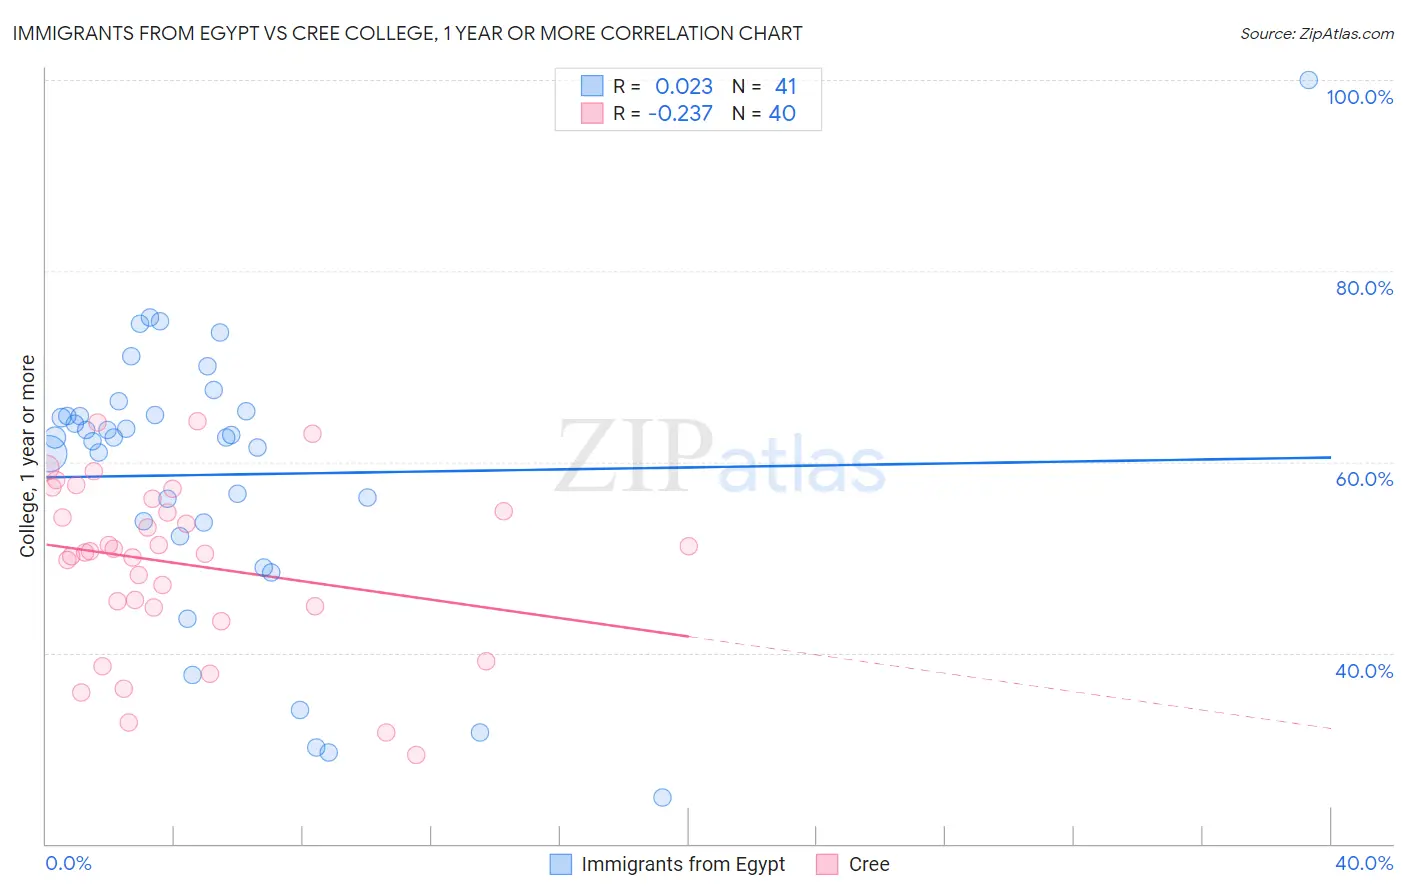
Immigrants from Egypt vs Cree College, 1 year or more Correlation Chart
The statistical analysis conducted on geographies consisting of 245,485,794 people shows no correlation between the proportion of Immigrants from Egypt and percentage of population with at least college, 1 year or more education in the United States with a correlation coefficient (R) of 0.023 and weighted average of 62.4%. Similarly, the statistical analysis conducted on geographies consisting of 76,211,685 people shows a weak negative correlation between the proportion of Cree and percentage of population with at least college, 1 year or more education in the United States with a correlation coefficient (R) of -0.237 and weighted average of 56.8%, a difference of 9.8%.
College, 1 year or more Correlation Summary
| Measurement | Immigrants from Egypt | Cree |
| Minimum | 24.8% | 29.2% |
| Maximum | 100.0% | 64.2% |
| Range | 75.2% | 35.0% |
| Mean | 58.7% | 49.3% |
| Median | 62.6% | 50.6% |
| Interquartile 25% (IQ1) | 53.0% | 44.8% |
| Interquartile 75% (IQ3) | 65.1% | 55.5% |
| Interquartile Range (IQR) | 12.1% | 10.7% |
| Standard Deviation (Sample) | 14.7% | 8.9% |
| Standard Deviation (Population) | 14.5% | 8.8% |
Similar Demographics by College, 1 year or more
Demographics Similar to Immigrants from Egypt by College, 1 year or more
In terms of college, 1 year or more, the demographic groups most similar to Immigrants from Egypt are Immigrants from Eastern Europe (62.4%, a difference of 0.010%), Romanian (62.4%, a difference of 0.030%), Immigrants from Croatia (62.3%, a difference of 0.090%), Immigrants from Western Asia (62.5%, a difference of 0.11%), and British (62.3%, a difference of 0.19%).
| Demographics | Rating | Rank | College, 1 year or more |
| Immigrants | Pakistan | 98.6 /100 | #85 | Exceptional 62.8% |
| Immigrants | Western Europe | 98.6 /100 | #86 | Exceptional 62.7% |
| Immigrants | Hungary | 98.6 /100 | #87 | Exceptional 62.7% |
| Greeks | 98.3 /100 | #88 | Exceptional 62.6% |
| Immigrants | Ethiopia | 98.2 /100 | #89 | Exceptional 62.6% |
| Immigrants | Western Asia | 97.9 /100 | #90 | Exceptional 62.5% |
| Immigrants | Eastern Europe | 97.8 /100 | #91 | Exceptional 62.4% |
| Immigrants | Egypt | 97.8 /100 | #92 | Exceptional 62.4% |
| Romanians | 97.7 /100 | #93 | Exceptional 62.4% |
| Immigrants | Croatia | 97.6 /100 | #94 | Exceptional 62.3% |
| British | 97.4 /100 | #95 | Exceptional 62.3% |
| Chinese | 97.2 /100 | #96 | Exceptional 62.2% |
| Jordanians | 97.2 /100 | #97 | Exceptional 62.2% |
| Carpatho Rusyns | 97.2 /100 | #98 | Exceptional 62.2% |
| Croatians | 97.1 /100 | #99 | Exceptional 62.2% |
Demographics Similar to Cree by College, 1 year or more
In terms of college, 1 year or more, the demographic groups most similar to Cree are Immigrants from Fiji (56.9%, a difference of 0.13%), Liberian (56.7%, a difference of 0.22%), Immigrants (57.0%, a difference of 0.28%), Immigrants from Western Africa (57.0%, a difference of 0.35%), and Vietnamese (57.0%, a difference of 0.37%).
| Demographics | Rating | Rank | College, 1 year or more |
| Sub-Saharan Africans | 6.1 /100 | #222 | Tragic 57.3% |
| Portuguese | 5.4 /100 | #223 | Tragic 57.2% |
| Hmong | 5.4 /100 | #224 | Tragic 57.2% |
| Vietnamese | 4.7 /100 | #225 | Tragic 57.0% |
| Immigrants | Western Africa | 4.6 /100 | #226 | Tragic 57.0% |
| Immigrants | Immigrants | 4.4 /100 | #227 | Tragic 57.0% |
| Immigrants | Fiji | 4.0 /100 | #228 | Tragic 56.9% |
| Cree | 3.6 /100 | #229 | Tragic 56.8% |
| Liberians | 3.1 /100 | #230 | Tragic 56.7% |
| Immigrants | Burma/Myanmar | 2.7 /100 | #231 | Tragic 56.6% |
| Immigrants | Bangladesh | 2.6 /100 | #232 | Tragic 56.6% |
| Immigrants | Nonimmigrants | 2.5 /100 | #233 | Tragic 56.5% |
| Spanish Americans | 1.8 /100 | #234 | Tragic 56.3% |
| West Indians | 1.8 /100 | #235 | Tragic 56.3% |
| Iroquois | 1.7 /100 | #236 | Tragic 56.2% |