Slavic vs Indian (Asian) College, 1 year or more
COMPARE
Slavic
Indian (Asian)
College, 1 year or more
College, 1 year or more Comparison
Slavs
Indians (Asian)
60.6%
COLLEGE, 1 YEAR OR MORE
81.1/ 100
METRIC RATING
145th/ 347
METRIC RANK
66.1%
COLLEGE, 1 YEAR OR MORE
100.0/ 100
METRIC RATING
25th/ 347
METRIC RANK
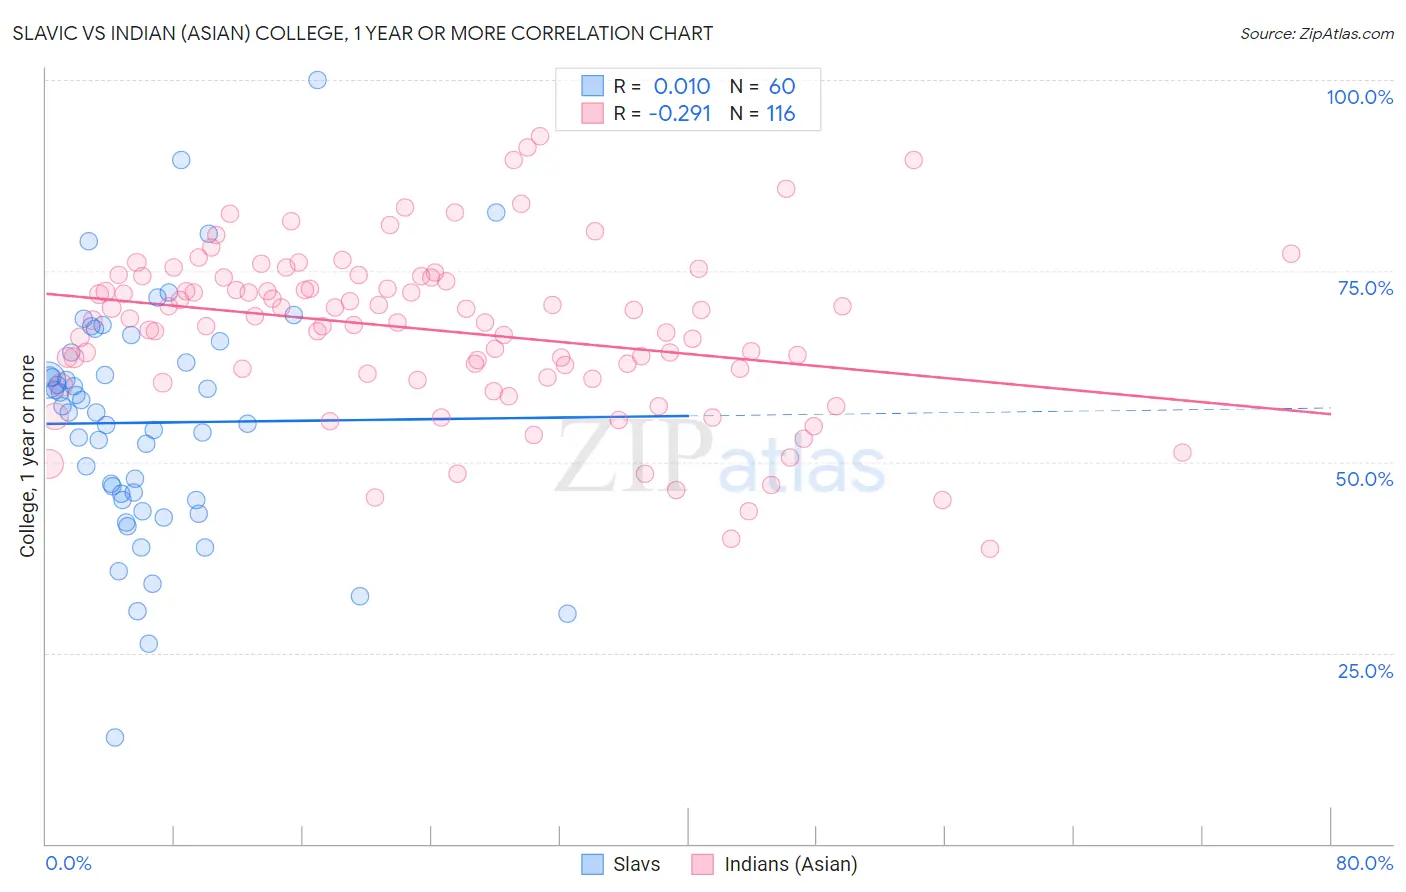
Slavic vs Indian (Asian) College, 1 year or more Correlation Chart
The statistical analysis conducted on geographies consisting of 270,867,316 people shows no correlation between the proportion of Slavs and percentage of population with at least college, 1 year or more education in the United States with a correlation coefficient (R) of 0.010 and weighted average of 60.6%. Similarly, the statistical analysis conducted on geographies consisting of 495,342,032 people shows a weak negative correlation between the proportion of Indians (Asian) and percentage of population with at least college, 1 year or more education in the United States with a correlation coefficient (R) of -0.291 and weighted average of 66.1%, a difference of 9.1%.
College, 1 year or more Correlation Summary
| Measurement | Slavic | Indian (Asian) |
| Minimum | 14.0% | 38.6% |
| Maximum | 100.0% | 92.7% |
| Range | 86.0% | 54.1% |
| Mean | 55.1% | 67.3% |
| Median | 56.5% | 68.7% |
| Interquartile 25% (IQ1) | 45.0% | 61.3% |
| Interquartile 75% (IQ3) | 63.6% | 74.1% |
| Interquartile Range (IQR) | 18.6% | 12.8% |
| Standard Deviation (Sample) | 15.6% | 10.8% |
| Standard Deviation (Population) | 15.4% | 10.8% |
Similar Demographics by College, 1 year or more
Demographics Similar to Slavs by College, 1 year or more
In terms of college, 1 year or more, the demographic groups most similar to Slavs are Czech (60.6%, a difference of 0.070%), Scottish (60.5%, a difference of 0.070%), Canadian (60.6%, a difference of 0.14%), Polish (60.7%, a difference of 0.15%), and Immigrants from Kenya (60.5%, a difference of 0.16%).
| Demographics | Rating | Rank | College, 1 year or more |
| Taiwanese | 84.3 /100 | #138 | Excellent 60.7% |
| Immigrants | Eritrea | 84.3 /100 | #139 | Excellent 60.7% |
| Iraqis | 83.3 /100 | #140 | Excellent 60.7% |
| Immigrants | Afghanistan | 83.1 /100 | #141 | Excellent 60.7% |
| Poles | 82.8 /100 | #142 | Excellent 60.7% |
| Canadians | 82.7 /100 | #143 | Excellent 60.6% |
| Czechs | 81.9 /100 | #144 | Excellent 60.6% |
| Slavs | 81.1 /100 | #145 | Excellent 60.6% |
| Scottish | 80.2 /100 | #146 | Excellent 60.5% |
| Immigrants | Kenya | 79.1 /100 | #147 | Good 60.5% |
| Kenyans | 79.0 /100 | #148 | Good 60.5% |
| Brazilians | 79.0 /100 | #149 | Good 60.5% |
| Immigrants | Sudan | 77.8 /100 | #150 | Good 60.4% |
| Albanians | 77.8 /100 | #151 | Good 60.4% |
| Immigrants | Germany | 76.1 /100 | #152 | Good 60.3% |
Demographics Similar to Indians (Asian) by College, 1 year or more
In terms of college, 1 year or more, the demographic groups most similar to Indians (Asian) are Latvian (66.1%, a difference of 0.040%), Immigrants from Ireland (65.9%, a difference of 0.24%), Immigrants from Belgium (66.3%, a difference of 0.35%), Immigrants from France (65.8%, a difference of 0.41%), and Immigrants from China (66.4%, a difference of 0.43%).
| Demographics | Rating | Rank | College, 1 year or more |
| Eastern Europeans | 100.0 /100 | #18 | Exceptional 66.6% |
| Immigrants | Switzerland | 100.0 /100 | #19 | Exceptional 66.5% |
| Immigrants | Korea | 100.0 /100 | #20 | Exceptional 66.5% |
| Immigrants | Hong Kong | 100.0 /100 | #21 | Exceptional 66.4% |
| Soviet Union | 100.0 /100 | #22 | Exceptional 66.4% |
| Immigrants | China | 100.0 /100 | #23 | Exceptional 66.4% |
| Immigrants | Belgium | 100.0 /100 | #24 | Exceptional 66.3% |
| Indians (Asian) | 100.0 /100 | #25 | Exceptional 66.1% |
| Latvians | 100.0 /100 | #26 | Exceptional 66.1% |
| Immigrants | Ireland | 100.0 /100 | #27 | Exceptional 65.9% |
| Immigrants | France | 100.0 /100 | #28 | Exceptional 65.8% |
| Immigrants | Northern Europe | 100.0 /100 | #29 | Exceptional 65.6% |
| Immigrants | Denmark | 100.0 /100 | #30 | Exceptional 65.6% |
| Turks | 100.0 /100 | #31 | Exceptional 65.5% |
| Bulgarians | 100.0 /100 | #32 | Exceptional 65.5% |