Shoshone vs Immigrants from the Azores Associate's Degree
COMPARE
Shoshone
Immigrants from the Azores
Associate's Degree
Associate's Degree Comparison
Shoshone
Immigrants from the Azores
38.4%
ASSOCIATE'S DEGREE
0.0/ 100
METRIC RATING
306th/ 347
METRIC RANK
35.6%
ASSOCIATE'S DEGREE
0.0/ 100
METRIC RATING
331st/ 347
METRIC RANK
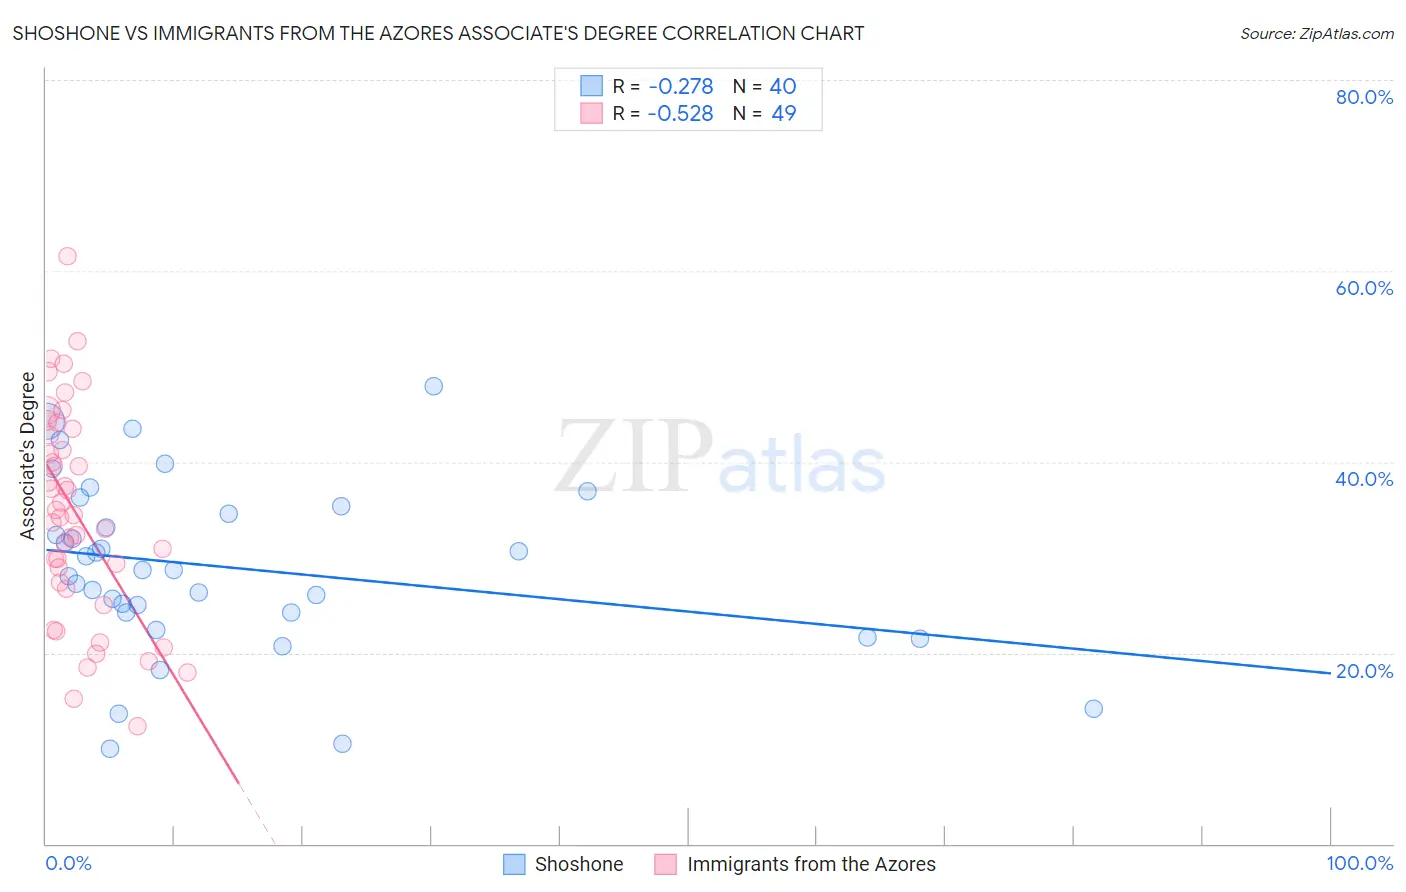
Shoshone vs Immigrants from the Azores Associate's Degree Correlation Chart
The statistical analysis conducted on geographies consisting of 66,627,351 people shows a weak negative correlation between the proportion of Shoshone and percentage of population with at least associate's degree education in the United States with a correlation coefficient (R) of -0.278 and weighted average of 38.4%. Similarly, the statistical analysis conducted on geographies consisting of 46,257,310 people shows a substantial negative correlation between the proportion of Immigrants from the Azores and percentage of population with at least associate's degree education in the United States with a correlation coefficient (R) of -0.528 and weighted average of 35.6%, a difference of 7.8%.
Associate's Degree Correlation Summary
| Measurement | Shoshone | Immigrants from the Azores |
| Minimum | 9.9% | 12.3% |
| Maximum | 47.9% | 61.6% |
| Range | 38.0% | 49.2% |
| Mean | 28.9% | 34.6% |
| Median | 28.7% | 34.4% |
| Interquartile 25% (IQ1) | 24.2% | 27.0% |
| Interquartile 75% (IQ3) | 35.0% | 43.1% |
| Interquartile Range (IQR) | 10.7% | 16.1% |
| Standard Deviation (Sample) | 9.0% | 11.0% |
| Standard Deviation (Population) | 8.8% | 10.9% |
Similar Demographics by Associate's Degree
Demographics Similar to Shoshone by Associate's Degree
In terms of associate's degree, the demographic groups most similar to Shoshone are Immigrants from El Salvador (38.4%, a difference of 0.040%), Immigrants from Honduras (38.5%, a difference of 0.070%), Sioux (38.5%, a difference of 0.13%), Guatemalan (38.5%, a difference of 0.19%), and Colville (38.5%, a difference of 0.27%).
| Demographics | Rating | Rank | Associate's Degree |
| Ute | 0.0 /100 | #299 | Tragic 38.6% |
| Chickasaw | 0.0 /100 | #300 | Tragic 38.6% |
| Tsimshian | 0.0 /100 | #301 | Tragic 38.6% |
| Colville | 0.0 /100 | #302 | Tragic 38.5% |
| Guatemalans | 0.0 /100 | #303 | Tragic 38.5% |
| Sioux | 0.0 /100 | #304 | Tragic 38.5% |
| Immigrants | Honduras | 0.0 /100 | #305 | Tragic 38.5% |
| Shoshone | 0.0 /100 | #306 | Tragic 38.4% |
| Immigrants | El Salvador | 0.0 /100 | #307 | Tragic 38.4% |
| Mexican American Indians | 0.0 /100 | #308 | Tragic 38.2% |
| Immigrants | Guatemala | 0.0 /100 | #309 | Tragic 38.1% |
| Immigrants | Dominican Republic | 0.0 /100 | #310 | Tragic 37.9% |
| Immigrants | Latin America | 0.0 /100 | #311 | Tragic 37.9% |
| Choctaw | 0.0 /100 | #312 | Tragic 37.8% |
| Hispanics or Latinos | 0.0 /100 | #313 | Tragic 37.7% |
Demographics Similar to Immigrants from the Azores by Associate's Degree
In terms of associate's degree, the demographic groups most similar to Immigrants from the Azores are Apache (36.2%, a difference of 1.7%), Immigrants from Central America (35.0%, a difference of 1.8%), Mexican (35.0%, a difference of 1.9%), Paiute (36.4%, a difference of 2.0%), and Native/Alaskan (34.9%, a difference of 2.1%).
| Demographics | Rating | Rank | Associate's Degree |
| Arapaho | 0.0 /100 | #324 | Tragic 36.7% |
| Menominee | 0.0 /100 | #325 | Tragic 36.7% |
| Kiowa | 0.0 /100 | #326 | Tragic 36.5% |
| Dutch West Indians | 0.0 /100 | #327 | Tragic 36.5% |
| Alaskan Athabascans | 0.0 /100 | #328 | Tragic 36.5% |
| Paiute | 0.0 /100 | #329 | Tragic 36.4% |
| Apache | 0.0 /100 | #330 | Tragic 36.2% |
| Immigrants | Azores | 0.0 /100 | #331 | Tragic 35.6% |
| Immigrants | Central America | 0.0 /100 | #332 | Tragic 35.0% |
| Mexicans | 0.0 /100 | #333 | Tragic 35.0% |
| Natives/Alaskans | 0.0 /100 | #334 | Tragic 34.9% |
| Spanish American Indians | 0.0 /100 | #335 | Tragic 34.9% |
| Hopi | 0.0 /100 | #336 | Tragic 34.6% |
| Lumbee | 0.0 /100 | #337 | Tragic 34.1% |
| Pueblo | 0.0 /100 | #338 | Tragic 34.0% |