Shoshone vs Immigrants from the Azores Cognitive Disability
COMPARE
Shoshone
Immigrants from the Azores
Cognitive Disability
Cognitive Disability Comparison
Shoshone
Immigrants from the Azores
17.3%
COGNITIVE DISABILITY
49.2/ 100
METRIC RATING
176th/ 347
METRIC RANK
17.9%
COGNITIVE DISABILITY
0.6/ 100
METRIC RATING
255th/ 347
METRIC RANK
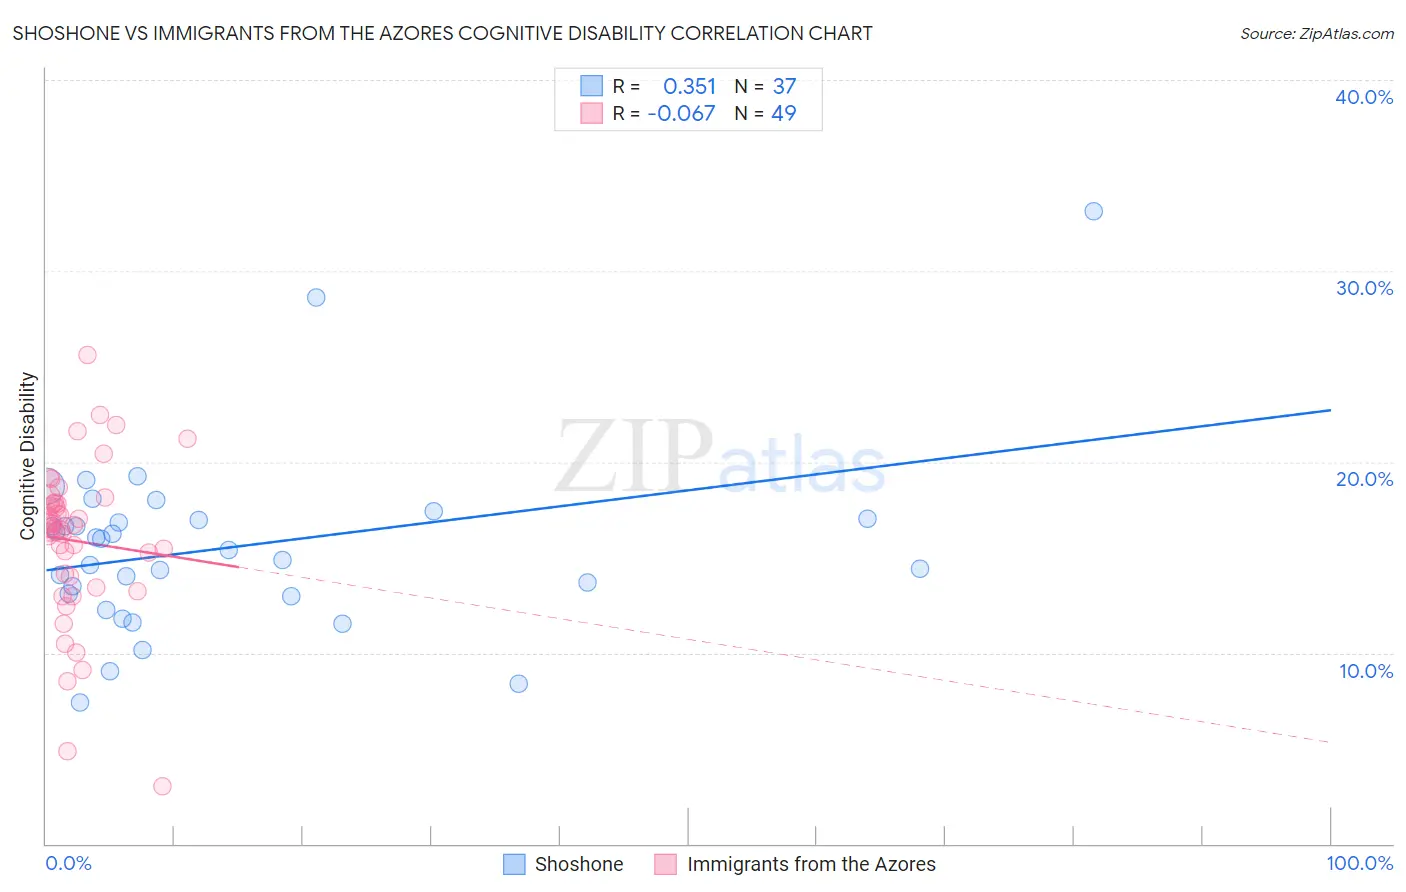
Shoshone vs Immigrants from the Azores Cognitive Disability Correlation Chart
The statistical analysis conducted on geographies consisting of 66,619,814 people shows a mild positive correlation between the proportion of Shoshone and percentage of population with cognitive disability in the United States with a correlation coefficient (R) of 0.351 and weighted average of 17.3%. Similarly, the statistical analysis conducted on geographies consisting of 46,257,310 people shows a slight negative correlation between the proportion of Immigrants from the Azores and percentage of population with cognitive disability in the United States with a correlation coefficient (R) of -0.067 and weighted average of 17.9%, a difference of 3.6%.
Cognitive Disability Correlation Summary
| Measurement | Shoshone | Immigrants from the Azores |
| Minimum | 7.4% | 3.0% |
| Maximum | 33.1% | 25.6% |
| Range | 25.7% | 22.6% |
| Mean | 15.5% | 15.9% |
| Median | 15.4% | 16.5% |
| Interquartile 25% (IQ1) | 13.0% | 13.7% |
| Interquartile 75% (IQ3) | 17.0% | 17.8% |
| Interquartile Range (IQR) | 4.0% | 4.1% |
| Standard Deviation (Sample) | 4.8% | 4.2% |
| Standard Deviation (Population) | 4.7% | 4.1% |
Similar Demographics by Cognitive Disability
Demographics Similar to Shoshone by Cognitive Disability
In terms of cognitive disability, the demographic groups most similar to Shoshone are Ute (17.3%, a difference of 0.0%), Spanish (17.3%, a difference of 0.010%), Laotian (17.3%, a difference of 0.020%), Tsimshian (17.3%, a difference of 0.020%), and Sioux (17.3%, a difference of 0.020%).
| Demographics | Rating | Rank | Cognitive Disability |
| Immigrants | Portugal | 61.8 /100 | #169 | Good 17.2% |
| Ecuadorians | 59.6 /100 | #170 | Average 17.2% |
| Tlingit-Haida | 59.4 /100 | #171 | Average 17.2% |
| Immigrants | Turkey | 56.7 /100 | #172 | Average 17.2% |
| Immigrants | Northern Africa | 50.2 /100 | #173 | Average 17.3% |
| Laotians | 50.0 /100 | #174 | Average 17.3% |
| Tsimshian | 49.8 /100 | #175 | Average 17.3% |
| Shoshone | 49.2 /100 | #176 | Average 17.3% |
| Ute | 49.1 /100 | #177 | Average 17.3% |
| Spanish | 48.9 /100 | #178 | Average 17.3% |
| Sioux | 48.6 /100 | #179 | Average 17.3% |
| Pakistanis | 43.9 /100 | #180 | Average 17.3% |
| Immigrants | Guyana | 42.9 /100 | #181 | Average 17.3% |
| Arabs | 42.8 /100 | #182 | Average 17.3% |
| Spaniards | 40.3 /100 | #183 | Average 17.3% |
Demographics Similar to Immigrants from the Azores by Cognitive Disability
In terms of cognitive disability, the demographic groups most similar to Immigrants from the Azores are Hispanic or Latino (17.9%, a difference of 0.0%), Bahamian (17.9%, a difference of 0.0%), Hopi (17.9%, a difference of 0.010%), Immigrants from Grenada (17.9%, a difference of 0.020%), and Malaysian (17.9%, a difference of 0.030%).
| Demographics | Rating | Rank | Cognitive Disability |
| French American Indians | 0.7 /100 | #248 | Tragic 17.9% |
| Cree | 0.7 /100 | #249 | Tragic 17.9% |
| Immigrants | Ethiopia | 0.7 /100 | #250 | Tragic 17.9% |
| Malaysians | 0.6 /100 | #251 | Tragic 17.9% |
| Immigrants | Grenada | 0.6 /100 | #252 | Tragic 17.9% |
| Hopi | 0.6 /100 | #253 | Tragic 17.9% |
| Hispanics or Latinos | 0.6 /100 | #254 | Tragic 17.9% |
| Immigrants | Azores | 0.6 /100 | #255 | Tragic 17.9% |
| Bahamians | 0.6 /100 | #256 | Tragic 17.9% |
| Mexican American Indians | 0.6 /100 | #257 | Tragic 17.9% |
| Immigrants | Armenia | 0.6 /100 | #258 | Tragic 17.9% |
| Ethiopians | 0.5 /100 | #259 | Tragic 17.9% |
| Immigrants | Belize | 0.5 /100 | #260 | Tragic 17.9% |
| Guamanians/Chamorros | 0.5 /100 | #261 | Tragic 17.9% |
| Sierra Leoneans | 0.4 /100 | #262 | Tragic 17.9% |