Shoshone vs Immigrants from Ireland Associate's Degree
COMPARE
Shoshone
Immigrants from Ireland
Associate's Degree
Associate's Degree Comparison
Shoshone
Immigrants from Ireland
38.4%
ASSOCIATE'S DEGREE
0.0/ 100
METRIC RATING
306th/ 347
METRIC RANK
54.7%
ASSOCIATE'S DEGREE
100.0/ 100
METRIC RATING
19th/ 347
METRIC RANK
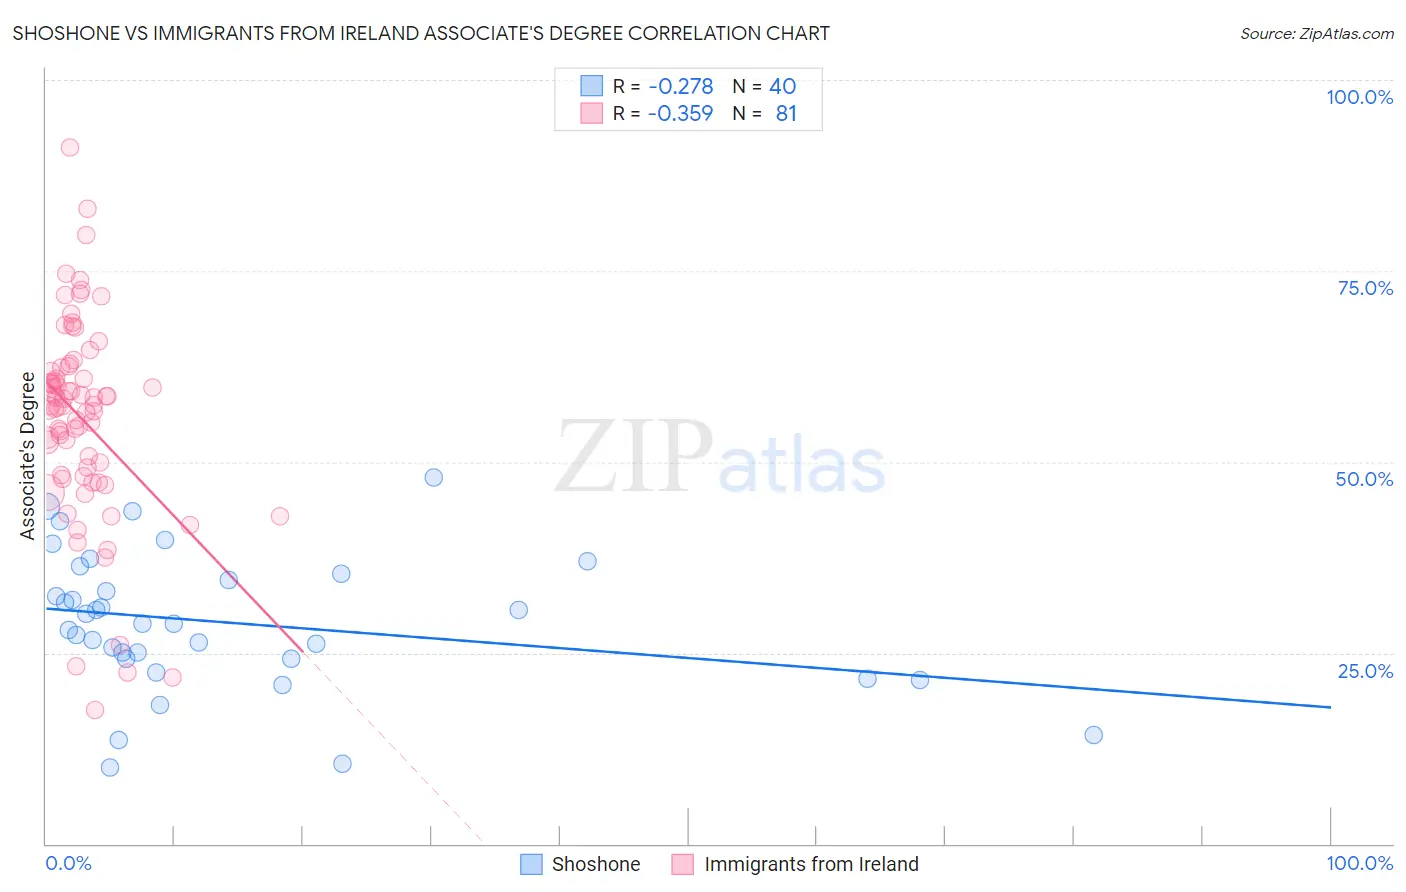
Shoshone vs Immigrants from Ireland Associate's Degree Correlation Chart
The statistical analysis conducted on geographies consisting of 66,627,351 people shows a weak negative correlation between the proportion of Shoshone and percentage of population with at least associate's degree education in the United States with a correlation coefficient (R) of -0.278 and weighted average of 38.4%. Similarly, the statistical analysis conducted on geographies consisting of 240,784,302 people shows a mild negative correlation between the proportion of Immigrants from Ireland and percentage of population with at least associate's degree education in the United States with a correlation coefficient (R) of -0.359 and weighted average of 54.7%, a difference of 42.2%.
Associate's Degree Correlation Summary
| Measurement | Shoshone | Immigrants from Ireland |
| Minimum | 9.9% | 17.6% |
| Maximum | 47.9% | 91.2% |
| Range | 38.0% | 73.6% |
| Mean | 28.9% | 55.6% |
| Median | 28.7% | 57.4% |
| Interquartile 25% (IQ1) | 24.2% | 48.2% |
| Interquartile 75% (IQ3) | 35.0% | 62.1% |
| Interquartile Range (IQR) | 10.7% | 13.9% |
| Standard Deviation (Sample) | 9.0% | 13.2% |
| Standard Deviation (Population) | 8.8% | 13.1% |
Similar Demographics by Associate's Degree
Demographics Similar to Shoshone by Associate's Degree
In terms of associate's degree, the demographic groups most similar to Shoshone are Immigrants from El Salvador (38.4%, a difference of 0.040%), Immigrants from Honduras (38.5%, a difference of 0.070%), Sioux (38.5%, a difference of 0.13%), Guatemalan (38.5%, a difference of 0.19%), and Colville (38.5%, a difference of 0.27%).
| Demographics | Rating | Rank | Associate's Degree |
| Ute | 0.0 /100 | #299 | Tragic 38.6% |
| Chickasaw | 0.0 /100 | #300 | Tragic 38.6% |
| Tsimshian | 0.0 /100 | #301 | Tragic 38.6% |
| Colville | 0.0 /100 | #302 | Tragic 38.5% |
| Guatemalans | 0.0 /100 | #303 | Tragic 38.5% |
| Sioux | 0.0 /100 | #304 | Tragic 38.5% |
| Immigrants | Honduras | 0.0 /100 | #305 | Tragic 38.5% |
| Shoshone | 0.0 /100 | #306 | Tragic 38.4% |
| Immigrants | El Salvador | 0.0 /100 | #307 | Tragic 38.4% |
| Mexican American Indians | 0.0 /100 | #308 | Tragic 38.2% |
| Immigrants | Guatemala | 0.0 /100 | #309 | Tragic 38.1% |
| Immigrants | Dominican Republic | 0.0 /100 | #310 | Tragic 37.9% |
| Immigrants | Latin America | 0.0 /100 | #311 | Tragic 37.9% |
| Choctaw | 0.0 /100 | #312 | Tragic 37.8% |
| Hispanics or Latinos | 0.0 /100 | #313 | Tragic 37.7% |
Demographics Similar to Immigrants from Ireland by Associate's Degree
In terms of associate's degree, the demographic groups most similar to Immigrants from Ireland are Cambodian (54.6%, a difference of 0.020%), Immigrants from Sweden (54.6%, a difference of 0.090%), Immigrants from Japan (54.6%, a difference of 0.12%), Burmese (54.6%, a difference of 0.12%), and Immigrants from Korea (54.5%, a difference of 0.21%).
| Demographics | Rating | Rank | Associate's Degree |
| Immigrants | South Central Asia | 100.0 /100 | #12 | Exceptional 55.7% |
| Immigrants | China | 100.0 /100 | #13 | Exceptional 55.5% |
| Immigrants | Hong Kong | 100.0 /100 | #14 | Exceptional 55.4% |
| Immigrants | Eastern Asia | 100.0 /100 | #15 | Exceptional 55.4% |
| Soviet Union | 100.0 /100 | #16 | Exceptional 55.1% |
| Eastern Europeans | 100.0 /100 | #17 | Exceptional 55.0% |
| Indians (Asian) | 100.0 /100 | #18 | Exceptional 54.8% |
| Immigrants | Ireland | 100.0 /100 | #19 | Exceptional 54.7% |
| Cambodians | 100.0 /100 | #20 | Exceptional 54.6% |
| Immigrants | Sweden | 100.0 /100 | #21 | Exceptional 54.6% |
| Immigrants | Japan | 100.0 /100 | #22 | Exceptional 54.6% |
| Burmese | 100.0 /100 | #23 | Exceptional 54.6% |
| Immigrants | Korea | 100.0 /100 | #24 | Exceptional 54.5% |
| Immigrants | Switzerland | 100.0 /100 | #25 | Exceptional 54.5% |
| Immigrants | Belgium | 100.0 /100 | #26 | Exceptional 54.5% |