Lithuanian vs Immigrants from the Azores Associate's Degree
COMPARE
Lithuanian
Immigrants from the Azores
Associate's Degree
Associate's Degree Comparison
Lithuanians
Immigrants from the Azores
50.6%
ASSOCIATE'S DEGREE
99.3/ 100
METRIC RATING
74th/ 347
METRIC RANK
35.6%
ASSOCIATE'S DEGREE
0.0/ 100
METRIC RATING
331st/ 347
METRIC RANK
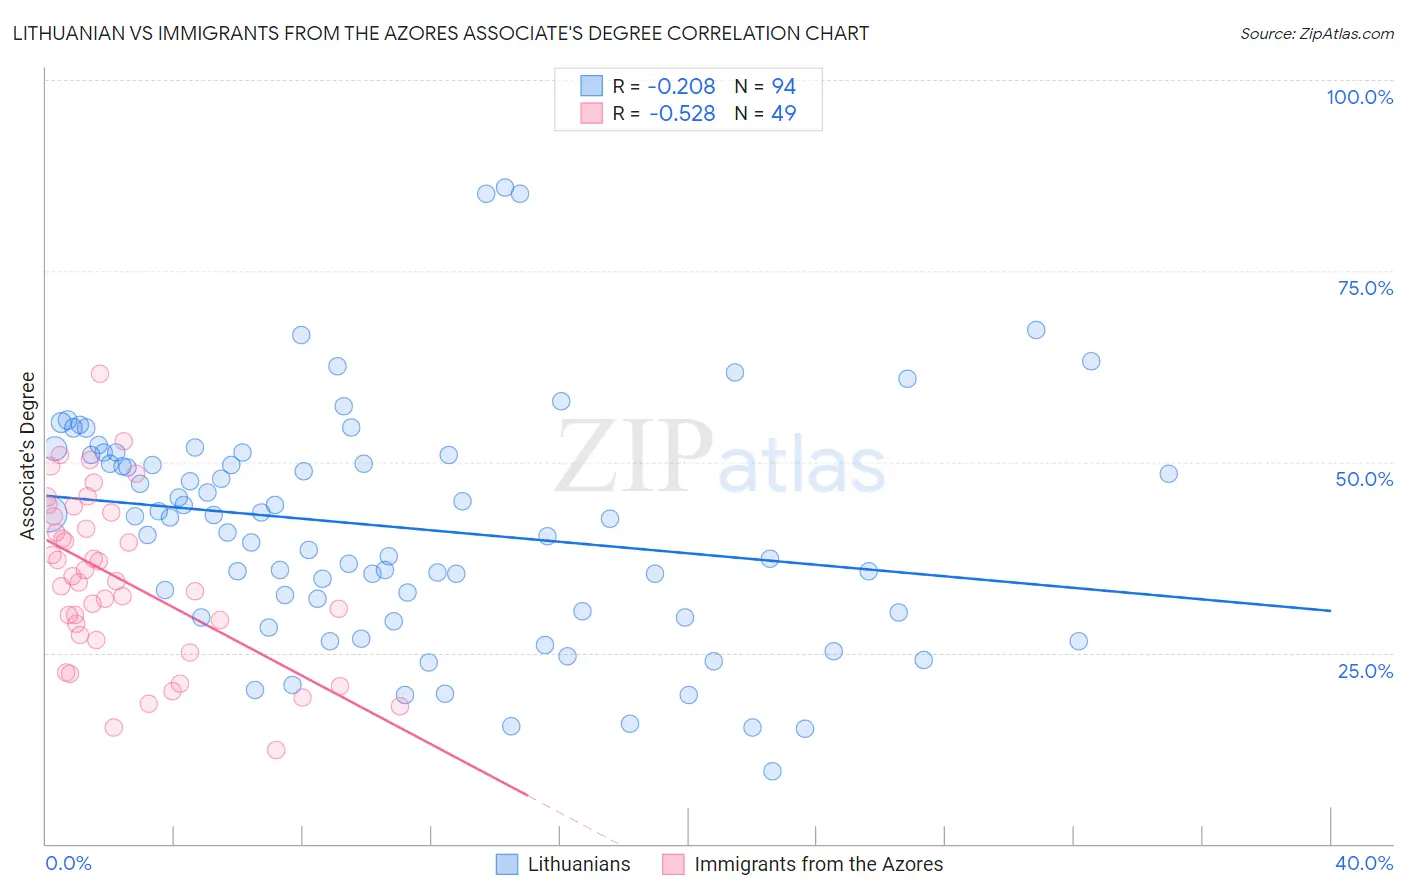
Lithuanian vs Immigrants from the Azores Associate's Degree Correlation Chart
The statistical analysis conducted on geographies consisting of 421,924,512 people shows a weak negative correlation between the proportion of Lithuanians and percentage of population with at least associate's degree education in the United States with a correlation coefficient (R) of -0.208 and weighted average of 50.6%. Similarly, the statistical analysis conducted on geographies consisting of 46,257,310 people shows a substantial negative correlation between the proportion of Immigrants from the Azores and percentage of population with at least associate's degree education in the United States with a correlation coefficient (R) of -0.528 and weighted average of 35.6%, a difference of 42.0%.
Associate's Degree Correlation Summary
| Measurement | Lithuanian | Immigrants from the Azores |
| Minimum | 9.5% | 12.3% |
| Maximum | 85.9% | 61.6% |
| Range | 76.4% | 49.2% |
| Mean | 41.4% | 34.6% |
| Median | 42.6% | 34.4% |
| Interquartile 25% (IQ1) | 30.2% | 27.0% |
| Interquartile 75% (IQ3) | 50.9% | 43.1% |
| Interquartile Range (IQR) | 20.7% | 16.1% |
| Standard Deviation (Sample) | 15.3% | 11.0% |
| Standard Deviation (Population) | 15.3% | 10.9% |
Similar Demographics by Associate's Degree
Demographics Similar to Lithuanians by Associate's Degree
In terms of associate's degree, the demographic groups most similar to Lithuanians are Immigrants from Scotland (50.6%, a difference of 0.040%), Carpatho Rusyn (50.6%, a difference of 0.060%), Immigrants from Zimbabwe (50.5%, a difference of 0.25%), Immigrants from Lebanon (50.5%, a difference of 0.28%), and Immigrants from Eastern Europe (50.5%, a difference of 0.33%).
| Demographics | Rating | Rank | Associate's Degree |
| Argentineans | 99.6 /100 | #67 | Exceptional 51.2% |
| Immigrants | Indonesia | 99.5 /100 | #68 | Exceptional 51.0% |
| Egyptians | 99.5 /100 | #69 | Exceptional 50.9% |
| Immigrants | Argentina | 99.5 /100 | #70 | Exceptional 50.9% |
| Immigrants | Romania | 99.5 /100 | #71 | Exceptional 50.9% |
| Immigrants | Pakistan | 99.5 /100 | #72 | Exceptional 50.9% |
| Carpatho Rusyns | 99.3 /100 | #73 | Exceptional 50.6% |
| Lithuanians | 99.3 /100 | #74 | Exceptional 50.6% |
| Immigrants | Scotland | 99.3 /100 | #75 | Exceptional 50.6% |
| Immigrants | Zimbabwe | 99.2 /100 | #76 | Exceptional 50.5% |
| Immigrants | Lebanon | 99.1 /100 | #77 | Exceptional 50.5% |
| Immigrants | Eastern Europe | 99.1 /100 | #78 | Exceptional 50.5% |
| Ethiopians | 99.1 /100 | #79 | Exceptional 50.4% |
| Armenians | 99.1 /100 | #80 | Exceptional 50.4% |
| Maltese | 99.1 /100 | #81 | Exceptional 50.4% |
Demographics Similar to Immigrants from the Azores by Associate's Degree
In terms of associate's degree, the demographic groups most similar to Immigrants from the Azores are Apache (36.2%, a difference of 1.7%), Immigrants from Central America (35.0%, a difference of 1.8%), Mexican (35.0%, a difference of 1.9%), Paiute (36.4%, a difference of 2.0%), and Native/Alaskan (34.9%, a difference of 2.1%).
| Demographics | Rating | Rank | Associate's Degree |
| Arapaho | 0.0 /100 | #324 | Tragic 36.7% |
| Menominee | 0.0 /100 | #325 | Tragic 36.7% |
| Kiowa | 0.0 /100 | #326 | Tragic 36.5% |
| Dutch West Indians | 0.0 /100 | #327 | Tragic 36.5% |
| Alaskan Athabascans | 0.0 /100 | #328 | Tragic 36.5% |
| Paiute | 0.0 /100 | #329 | Tragic 36.4% |
| Apache | 0.0 /100 | #330 | Tragic 36.2% |
| Immigrants | Azores | 0.0 /100 | #331 | Tragic 35.6% |
| Immigrants | Central America | 0.0 /100 | #332 | Tragic 35.0% |
| Mexicans | 0.0 /100 | #333 | Tragic 35.0% |
| Natives/Alaskans | 0.0 /100 | #334 | Tragic 34.9% |
| Spanish American Indians | 0.0 /100 | #335 | Tragic 34.9% |
| Hopi | 0.0 /100 | #336 | Tragic 34.6% |
| Lumbee | 0.0 /100 | #337 | Tragic 34.1% |
| Pueblo | 0.0 /100 | #338 | Tragic 34.0% |