Shoshone vs Yugoslavian Associate's Degree
COMPARE
Shoshone
Yugoslavian
Associate's Degree
Associate's Degree Comparison
Shoshone
Yugoslavians
38.4%
ASSOCIATE'S DEGREE
0.0/ 100
METRIC RATING
306th/ 347
METRIC RANK
46.0%
ASSOCIATE'S DEGREE
40.2/ 100
METRIC RATING
183rd/ 347
METRIC RANK
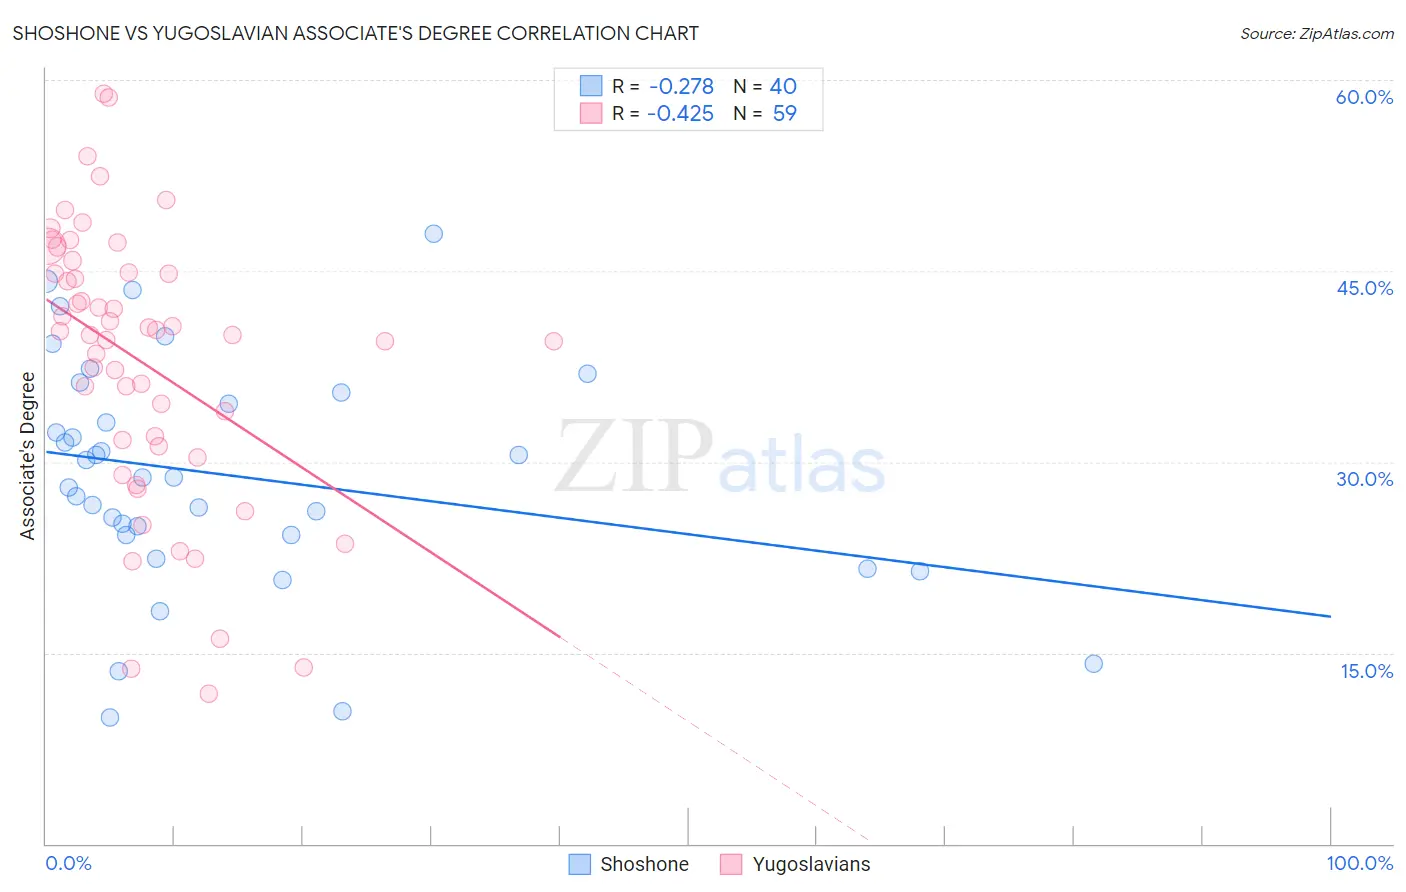
Shoshone vs Yugoslavian Associate's Degree Correlation Chart
The statistical analysis conducted on geographies consisting of 66,627,351 people shows a weak negative correlation between the proportion of Shoshone and percentage of population with at least associate's degree education in the United States with a correlation coefficient (R) of -0.278 and weighted average of 38.4%. Similarly, the statistical analysis conducted on geographies consisting of 285,717,072 people shows a moderate negative correlation between the proportion of Yugoslavians and percentage of population with at least associate's degree education in the United States with a correlation coefficient (R) of -0.425 and weighted average of 46.0%, a difference of 19.7%.
Associate's Degree Correlation Summary
| Measurement | Shoshone | Yugoslavian |
| Minimum | 9.9% | 11.8% |
| Maximum | 47.9% | 58.9% |
| Range | 38.0% | 47.2% |
| Mean | 28.9% | 37.9% |
| Median | 28.7% | 40.0% |
| Interquartile 25% (IQ1) | 24.2% | 31.3% |
| Interquartile 75% (IQ3) | 35.0% | 44.9% |
| Interquartile Range (IQR) | 10.7% | 13.6% |
| Standard Deviation (Sample) | 9.0% | 10.8% |
| Standard Deviation (Population) | 8.8% | 10.7% |
Similar Demographics by Associate's Degree
Demographics Similar to Shoshone by Associate's Degree
In terms of associate's degree, the demographic groups most similar to Shoshone are Immigrants from El Salvador (38.4%, a difference of 0.040%), Immigrants from Honduras (38.5%, a difference of 0.070%), Sioux (38.5%, a difference of 0.13%), Guatemalan (38.5%, a difference of 0.19%), and Colville (38.5%, a difference of 0.27%).
| Demographics | Rating | Rank | Associate's Degree |
| Ute | 0.0 /100 | #299 | Tragic 38.6% |
| Chickasaw | 0.0 /100 | #300 | Tragic 38.6% |
| Tsimshian | 0.0 /100 | #301 | Tragic 38.6% |
| Colville | 0.0 /100 | #302 | Tragic 38.5% |
| Guatemalans | 0.0 /100 | #303 | Tragic 38.5% |
| Sioux | 0.0 /100 | #304 | Tragic 38.5% |
| Immigrants | Honduras | 0.0 /100 | #305 | Tragic 38.5% |
| Shoshone | 0.0 /100 | #306 | Tragic 38.4% |
| Immigrants | El Salvador | 0.0 /100 | #307 | Tragic 38.4% |
| Mexican American Indians | 0.0 /100 | #308 | Tragic 38.2% |
| Immigrants | Guatemala | 0.0 /100 | #309 | Tragic 38.1% |
| Immigrants | Dominican Republic | 0.0 /100 | #310 | Tragic 37.9% |
| Immigrants | Latin America | 0.0 /100 | #311 | Tragic 37.9% |
| Choctaw | 0.0 /100 | #312 | Tragic 37.8% |
| Hispanics or Latinos | 0.0 /100 | #313 | Tragic 37.7% |
Demographics Similar to Yugoslavians by Associate's Degree
In terms of associate's degree, the demographic groups most similar to Yugoslavians are Swiss (46.0%, a difference of 0.010%), Czechoslovakian (46.0%, a difference of 0.020%), Immigrants from Colombia (46.0%, a difference of 0.080%), Costa Rican (46.0%, a difference of 0.13%), and Welsh (45.9%, a difference of 0.19%).
| Demographics | Rating | Rank | Associate's Degree |
| Finns | 48.5 /100 | #176 | Average 46.3% |
| Slovaks | 48.4 /100 | #177 | Average 46.3% |
| Immigrants | Bosnia and Herzegovina | 48.3 /100 | #178 | Average 46.3% |
| Sri Lankans | 47.6 /100 | #179 | Average 46.3% |
| Bermudans | 46.4 /100 | #180 | Average 46.2% |
| Immigrants | Colombia | 41.3 /100 | #181 | Average 46.0% |
| Swiss | 40.4 /100 | #182 | Average 46.0% |
| Yugoslavians | 40.2 /100 | #183 | Average 46.0% |
| Czechoslovakians | 40.0 /100 | #184 | Average 46.0% |
| Costa Ricans | 38.6 /100 | #185 | Fair 46.0% |
| Welsh | 37.9 /100 | #186 | Fair 45.9% |
| Immigrants | Uruguay | 35.5 /100 | #187 | Fair 45.8% |
| Ghanaians | 35.5 /100 | #188 | Fair 45.8% |
| Immigrants | Oceania | 34.7 /100 | #189 | Fair 45.8% |
| Vietnamese | 34.0 /100 | #190 | Fair 45.8% |