Czech vs Immigrants from the Azores Associate's Degree
COMPARE
Czech
Immigrants from the Azores
Associate's Degree
Associate's Degree Comparison
Czechs
Immigrants from the Azores
47.2%
ASSOCIATE'S DEGREE
72.2/ 100
METRIC RATING
153rd/ 347
METRIC RANK
35.6%
ASSOCIATE'S DEGREE
0.0/ 100
METRIC RATING
331st/ 347
METRIC RANK
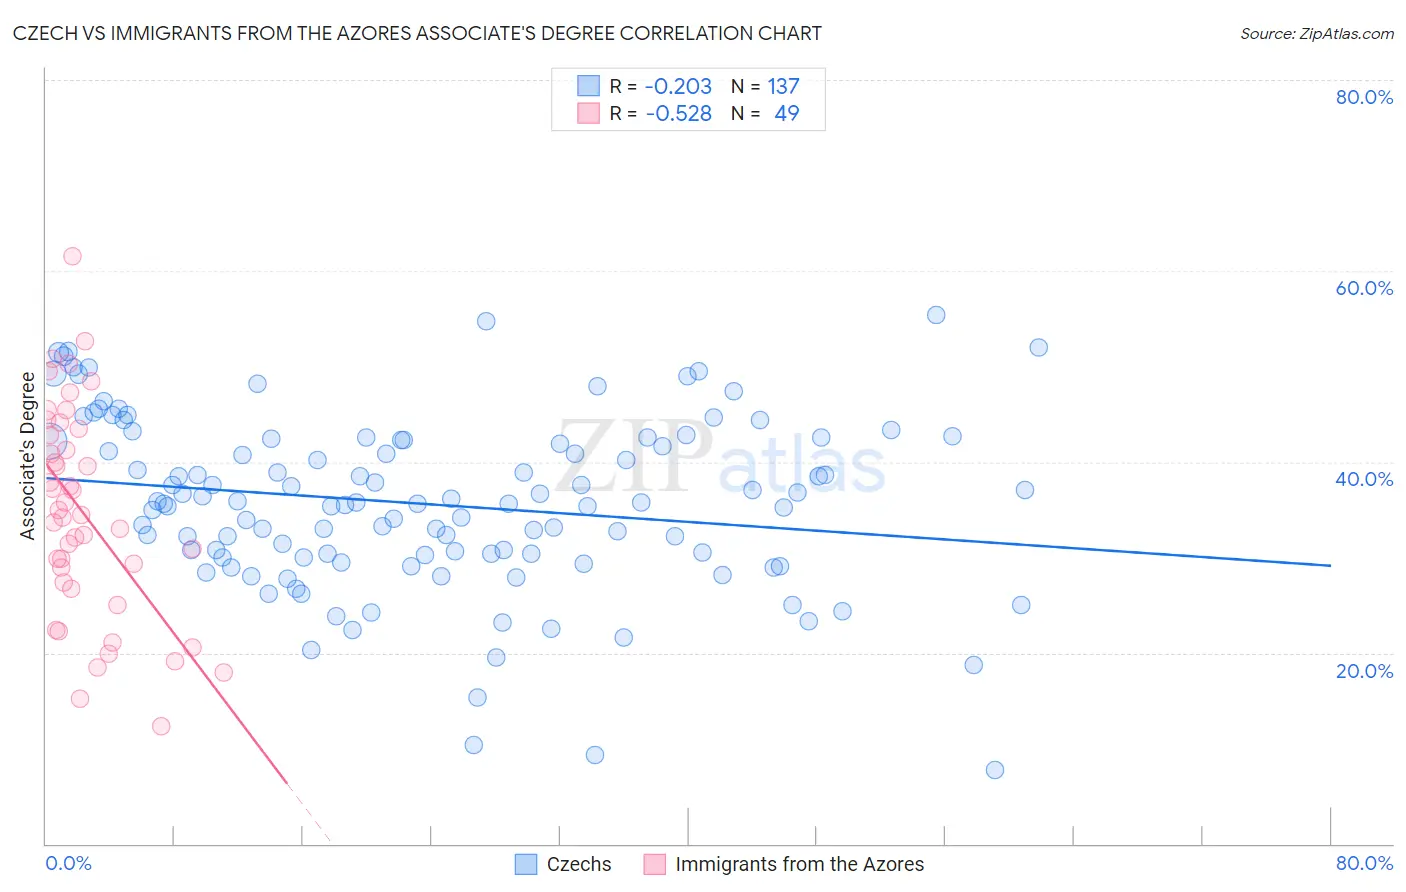
Czech vs Immigrants from the Azores Associate's Degree Correlation Chart
The statistical analysis conducted on geographies consisting of 484,784,602 people shows a weak negative correlation between the proportion of Czechs and percentage of population with at least associate's degree education in the United States with a correlation coefficient (R) of -0.203 and weighted average of 47.2%. Similarly, the statistical analysis conducted on geographies consisting of 46,257,310 people shows a substantial negative correlation between the proportion of Immigrants from the Azores and percentage of population with at least associate's degree education in the United States with a correlation coefficient (R) of -0.528 and weighted average of 35.6%, a difference of 32.4%.
Associate's Degree Correlation Summary
| Measurement | Czech | Immigrants from the Azores |
| Minimum | 7.7% | 12.3% |
| Maximum | 55.4% | 61.6% |
| Range | 47.7% | 49.2% |
| Mean | 35.6% | 34.6% |
| Median | 35.7% | 34.4% |
| Interquartile 25% (IQ1) | 30.1% | 27.0% |
| Interquartile 75% (IQ3) | 42.3% | 43.1% |
| Interquartile Range (IQR) | 12.2% | 16.1% |
| Standard Deviation (Sample) | 9.1% | 11.0% |
| Standard Deviation (Population) | 9.0% | 10.9% |
Similar Demographics by Associate's Degree
Demographics Similar to Czechs by Associate's Degree
In terms of associate's degree, the demographic groups most similar to Czechs are Immigrants from Kenya (47.2%, a difference of 0.010%), Kenyan (47.1%, a difference of 0.14%), South American (47.1%, a difference of 0.16%), Sudanese (47.1%, a difference of 0.18%), and Immigrants from Afghanistan (47.3%, a difference of 0.19%).
| Demographics | Rating | Rank | Associate's Degree |
| Immigrants | Sudan | 77.9 /100 | #146 | Good 47.4% |
| Danes | 77.3 /100 | #147 | Good 47.4% |
| South American Indians | 76.7 /100 | #148 | Good 47.4% |
| Immigrants | Armenia | 76.6 /100 | #149 | Good 47.4% |
| Iraqis | 76.2 /100 | #150 | Good 47.4% |
| Immigrants | North Macedonia | 76.0 /100 | #151 | Good 47.4% |
| Immigrants | Afghanistan | 74.3 /100 | #152 | Good 47.3% |
| Czechs | 72.2 /100 | #153 | Good 47.2% |
| Immigrants | Kenya | 72.1 /100 | #154 | Good 47.2% |
| Kenyans | 70.6 /100 | #155 | Good 47.1% |
| South Americans | 70.5 /100 | #156 | Good 47.1% |
| Sudanese | 70.3 /100 | #157 | Good 47.1% |
| Immigrants | Germany | 69.7 /100 | #158 | Good 47.1% |
| Immigrants | Poland | 69.2 /100 | #159 | Good 47.1% |
| Scottish | 65.4 /100 | #160 | Good 46.9% |
Demographics Similar to Immigrants from the Azores by Associate's Degree
In terms of associate's degree, the demographic groups most similar to Immigrants from the Azores are Apache (36.2%, a difference of 1.7%), Immigrants from Central America (35.0%, a difference of 1.8%), Mexican (35.0%, a difference of 1.9%), Paiute (36.4%, a difference of 2.0%), and Native/Alaskan (34.9%, a difference of 2.1%).
| Demographics | Rating | Rank | Associate's Degree |
| Arapaho | 0.0 /100 | #324 | Tragic 36.7% |
| Menominee | 0.0 /100 | #325 | Tragic 36.7% |
| Kiowa | 0.0 /100 | #326 | Tragic 36.5% |
| Dutch West Indians | 0.0 /100 | #327 | Tragic 36.5% |
| Alaskan Athabascans | 0.0 /100 | #328 | Tragic 36.5% |
| Paiute | 0.0 /100 | #329 | Tragic 36.4% |
| Apache | 0.0 /100 | #330 | Tragic 36.2% |
| Immigrants | Azores | 0.0 /100 | #331 | Tragic 35.6% |
| Immigrants | Central America | 0.0 /100 | #332 | Tragic 35.0% |
| Mexicans | 0.0 /100 | #333 | Tragic 35.0% |
| Natives/Alaskans | 0.0 /100 | #334 | Tragic 34.9% |
| Spanish American Indians | 0.0 /100 | #335 | Tragic 34.9% |
| Hopi | 0.0 /100 | #336 | Tragic 34.6% |
| Lumbee | 0.0 /100 | #337 | Tragic 34.1% |
| Pueblo | 0.0 /100 | #338 | Tragic 34.0% |