Osage vs Immigrants from the Azores Associate's Degree
COMPARE
Osage
Immigrants from the Azores
Associate's Degree
Associate's Degree Comparison
Osage
Immigrants from the Azores
41.5%
ASSOCIATE'S DEGREE
0.3/ 100
METRIC RATING
264th/ 347
METRIC RANK
35.6%
ASSOCIATE'S DEGREE
0.0/ 100
METRIC RATING
331st/ 347
METRIC RANK
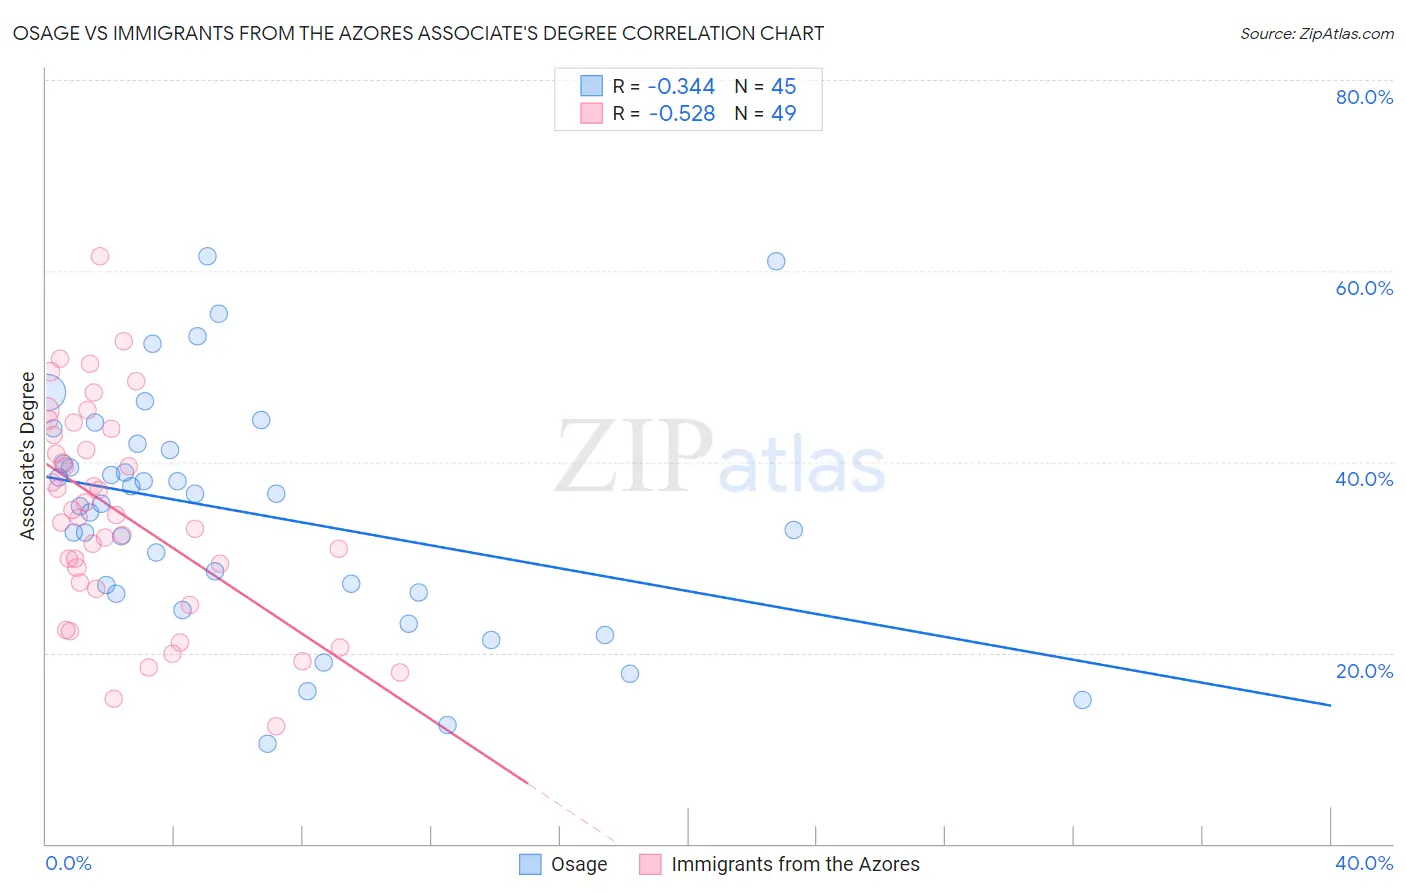
Osage vs Immigrants from the Azores Associate's Degree Correlation Chart
The statistical analysis conducted on geographies consisting of 91,808,929 people shows a mild negative correlation between the proportion of Osage and percentage of population with at least associate's degree education in the United States with a correlation coefficient (R) of -0.344 and weighted average of 41.5%. Similarly, the statistical analysis conducted on geographies consisting of 46,257,310 people shows a substantial negative correlation between the proportion of Immigrants from the Azores and percentage of population with at least associate's degree education in the United States with a correlation coefficient (R) of -0.528 and weighted average of 35.6%, a difference of 16.3%.
Associate's Degree Correlation Summary
| Measurement | Osage | Immigrants from the Azores |
| Minimum | 10.4% | 12.3% |
| Maximum | 61.5% | 61.6% |
| Range | 51.1% | 49.2% |
| Mean | 34.6% | 34.6% |
| Median | 35.6% | 34.4% |
| Interquartile 25% (IQ1) | 26.3% | 27.0% |
| Interquartile 75% (IQ3) | 41.5% | 43.1% |
| Interquartile Range (IQR) | 15.3% | 16.1% |
| Standard Deviation (Sample) | 12.2% | 11.0% |
| Standard Deviation (Population) | 12.1% | 10.9% |
Similar Demographics by Associate's Degree
Demographics Similar to Osage by Associate's Degree
In terms of associate's degree, the demographic groups most similar to Osage are Immigrants from Jamaica (41.5%, a difference of 0.010%), Bahamian (41.5%, a difference of 0.030%), Nicaraguan (41.5%, a difference of 0.12%), Marshallese (41.6%, a difference of 0.25%), and Malaysian (41.6%, a difference of 0.44%).
| Demographics | Rating | Rank | Associate's Degree |
| Spanish Americans | 0.5 /100 | #257 | Tragic 41.8% |
| Japanese | 0.5 /100 | #258 | Tragic 41.7% |
| Malaysians | 0.4 /100 | #259 | Tragic 41.6% |
| Marshallese | 0.4 /100 | #260 | Tragic 41.6% |
| Nicaraguans | 0.4 /100 | #261 | Tragic 41.5% |
| Bahamians | 0.4 /100 | #262 | Tragic 41.5% |
| Immigrants | Jamaica | 0.3 /100 | #263 | Tragic 41.5% |
| Osage | 0.3 /100 | #264 | Tragic 41.5% |
| Africans | 0.2 /100 | #265 | Tragic 41.1% |
| Samoans | 0.2 /100 | #266 | Tragic 41.1% |
| Hawaiians | 0.2 /100 | #267 | Tragic 40.9% |
| Central American Indians | 0.2 /100 | #268 | Tragic 40.8% |
| Americans | 0.2 /100 | #269 | Tragic 40.8% |
| Chippewa | 0.2 /100 | #270 | Tragic 40.7% |
| Immigrants | Laos | 0.1 /100 | #271 | Tragic 40.7% |
Demographics Similar to Immigrants from the Azores by Associate's Degree
In terms of associate's degree, the demographic groups most similar to Immigrants from the Azores are Apache (36.2%, a difference of 1.7%), Immigrants from Central America (35.0%, a difference of 1.8%), Mexican (35.0%, a difference of 1.9%), Paiute (36.4%, a difference of 2.0%), and Native/Alaskan (34.9%, a difference of 2.1%).
| Demographics | Rating | Rank | Associate's Degree |
| Arapaho | 0.0 /100 | #324 | Tragic 36.7% |
| Menominee | 0.0 /100 | #325 | Tragic 36.7% |
| Kiowa | 0.0 /100 | #326 | Tragic 36.5% |
| Dutch West Indians | 0.0 /100 | #327 | Tragic 36.5% |
| Alaskan Athabascans | 0.0 /100 | #328 | Tragic 36.5% |
| Paiute | 0.0 /100 | #329 | Tragic 36.4% |
| Apache | 0.0 /100 | #330 | Tragic 36.2% |
| Immigrants | Azores | 0.0 /100 | #331 | Tragic 35.6% |
| Immigrants | Central America | 0.0 /100 | #332 | Tragic 35.0% |
| Mexicans | 0.0 /100 | #333 | Tragic 35.0% |
| Natives/Alaskans | 0.0 /100 | #334 | Tragic 34.9% |
| Spanish American Indians | 0.0 /100 | #335 | Tragic 34.9% |
| Hopi | 0.0 /100 | #336 | Tragic 34.6% |
| Lumbee | 0.0 /100 | #337 | Tragic 34.1% |
| Pueblo | 0.0 /100 | #338 | Tragic 34.0% |