Shoshone vs Immigrants from the Azores Master's Degree

COMPARE

Shoshone
Race
Ancestry
AfghanAfricanAlaska NativeAlaskan AthabascanAlbanianAleutAlsatianAmericanApacheArabArapahoArgentineanArmenianAssyrian/Chaldean/SyriacAustralianAustrianBahamianBangladeshiBarbadianBasqueBelgianBelizeanBermudanBhutaneseBlackfeetBolivianBrazilianBritishBritish West IndianBulgarianBurmeseCajunCambodianCanadianCape VerdeanCarpatho RusynCelticCentral AmericanCentral American IndianCherokeeCheyenneChickasawChileanChineseChippewaChoctawColombianColvilleComancheCosta RicanCreeCreekCroatianCrowCubanCypriotCzechCzechoslovakianDanishDelawareDominicanDutchDutch West IndianEastern EuropeanEcuadorianEgyptianEnglishEstonianEthiopianEuropeanFijianFilipinoFinnishFrenchFrench American IndianFrench CanadianGermanGerman RussianGhanaianGreekGuamanian/ChamorroGuatemalanGuyaneseHaitianHmongHonduranHopiHoumaHungarianIcelanderIndian (Asian)IndonesianInupiatIranianIraqiIrishIroquoisIsraeliItalianJamaicanJapaneseJordanianKenyanKiowaKoreanLaotianLatvianLebaneseLiberianLithuanianLumbeeLuxembourgerMacedonianMalaysianMalteseMarshalleseMenomineeMexicanMexican American IndianMongolianMoroccanNative HawaiianNavajoNepaleseNew ZealanderNicaraguanNigerianNorthern EuropeanNorwegianOkinawanOsageOttawaPaiutePakistaniPalestinianPanamanianParaguayanPennsylvania GermanPeruvianPimaPolishPortuguesePotawatomiPuebloPuerto RicanPuget Sound SalishRomanianRussianSalvadoranSamoanScandinavianScotch-IrishScottishSeminoleSenegaleseSerbianShoshoneSierra LeoneanSiouxSlavicSlovakSloveneSomaliSouth AfricanSouth AmericanSouth American IndianSoviet UnionSpaniardSpanishSpanish AmericanSpanish American IndianSri LankanSubsaharan AfricanSudaneseSwedishSwissSyrianTaiwaneseThaiTlingit-HaidaTohono O'OdhamTonganTrinidadian and TobagonianTsimshianTurkishU.S. Virgin IslanderUgandanUkrainianUruguayanUteVenezuelanVietnameseWelshWest IndianYakamaYaquiYugoslavianYumanYup'ikZimbabwean
Immigration
NonimmigrantsImmigrantsAfghanistanAfricaAlbaniaArgentinaArmeniaAsiaAustraliaAustriaBahamasBangladeshBarbadosBelarusBelgiumBelizeBoliviaBosnia and HerzegovinaBrazilBulgariaBurma/MyanmarCabo VerdeCambodiaCameroonCanadaCaribbeanCentral AmericaChileChinaColombiaCongoCosta RicaCroatiaCubaCzechoslovakiaDenmarkDominicaDominican RepublicEastern AfricaEastern AsiaEastern EuropeEcuadorEgyptEl SalvadorEnglandEritreaEthiopiaEuropeFijiFranceGermanyGhanaGreeceGrenadaGuatemalaGuyanaHaitiHondurasHong KongHungaryIndiaIndonesiaIranIraqIrelandIsraelItalyJamaicaJapanJordanKazakhstanKenyaKoreaKuwaitLaosLatin AmericaLatviaLebanonLiberiaLithuaniaMalaysiaMexicoMicronesiaMiddle AfricaMoldovaMoroccoNepalNetherlandsNicaraguaNigeriaNorth AmericaNorth MacedoniaNorthern AfricaNorthern EuropeNorwayOceaniaPakistanPanamaPeruPhilippinesPolandPortugalRomaniaRussiaSaudi ArabiaScotlandSenegalSerbiaSierra LeoneSingaporeSomaliaSouth AfricaSouth AmericaSouth Central AsiaSouth Eastern AsiaSouthern EuropeSpainSri LankaSt. Vincent and the GrenadinesSudanSwedenSwitzerlandSyriaTaiwanThailandTrinidad and TobagoTurkeyUgandaUkraineUruguayUzbekistanVenezuelaVietnamWest IndiesWestern AfricaWestern AsiaWestern EuropeYemenZaireZimbabwe
Immigrants from the Azores
Race
Ancestry
AfghanAfricanAlaska NativeAlaskan AthabascanAlbanianAleutAlsatianAmericanApacheArabArapahoArgentineanArmenianAssyrian/Chaldean/SyriacAustralianAustrianBahamianBangladeshiBarbadianBasqueBelgianBelizeanBermudanBhutaneseBlackfeetBolivianBrazilianBritishBritish West IndianBulgarianBurmeseCajunCambodianCanadianCape VerdeanCarpatho RusynCelticCentral AmericanCentral American IndianCherokeeCheyenneChickasawChileanChineseChippewaChoctawColombianColvilleComancheCosta RicanCreeCreekCroatianCrowCubanCypriotCzechCzechoslovakianDanishDelawareDominicanDutchDutch West IndianEastern EuropeanEcuadorianEgyptianEnglishEstonianEthiopianEuropeanFijianFilipinoFinnishFrenchFrench American IndianFrench CanadianGermanGerman RussianGhanaianGreekGuamanian/ChamorroGuatemalanGuyaneseHaitianHmongHonduranHopiHoumaHungarianIcelanderIndian (Asian)IndonesianInupiatIranianIraqiIrishIroquoisIsraeliItalianJamaicanJapaneseJordanianKenyanKiowaKoreanLaotianLatvianLebaneseLiberianLithuanianLumbeeLuxembourgerMacedonianMalaysianMalteseMarshalleseMenomineeMexicanMexican American IndianMongolianMoroccanNative HawaiianNavajoNepaleseNew ZealanderNicaraguanNigerianNorthern EuropeanNorwegianOkinawanOsageOttawaPaiutePakistaniPalestinianPanamanianParaguayanPennsylvania GermanPeruvianPimaPolishPortuguesePotawatomiPuebloPuerto RicanPuget Sound SalishRomanianRussianSalvadoranSamoanScandinavianScotch-IrishScottishSeminoleSenegaleseSerbianSierra LeoneanSiouxSlavicSlovakSloveneSomaliSouth AfricanSouth AmericanSouth American IndianSoviet UnionSpaniardSpanishSpanish AmericanSpanish American IndianSri LankanSubsaharan AfricanSudaneseSwedishSwissSyrianTaiwaneseThaiTlingit-HaidaTohono O'OdhamTonganTrinidadian and TobagonianTsimshianTurkishU.S. Virgin IslanderUgandanUkrainianUruguayanUteVenezuelanVietnameseWelshWest IndianYakamaYaquiYugoslavianYumanYup'ikZimbabwean
Immigration
NonimmigrantsImmigrantsAfghanistanAfricaAlbaniaArgentinaArmeniaAsiaAustraliaAustriaBahamasBangladeshBarbadosBelarusBelgiumBelizeBoliviaBosnia and HerzegovinaBrazilBulgariaBurma/MyanmarCabo VerdeCambodiaCameroonCanadaCaribbeanCentral AmericaChileChinaColombiaCongoCosta RicaCroatiaCubaCzechoslovakiaDenmarkDominicaDominican RepublicEastern AfricaEastern AsiaEastern EuropeEcuadorEgyptEl SalvadorEnglandEritreaEthiopiaEuropeFijiFranceGermanyGhanaGreeceGrenadaGuatemalaGuyanaHaitiHondurasHong KongHungaryIndiaIndonesiaIranIraqIrelandIsraelItalyJamaicaJapanJordanKazakhstanKenyaKoreaKuwaitLaosLatin AmericaLatviaLebanonLiberiaLithuaniaMalaysiaMexicoMicronesiaMiddle AfricaMoldovaMoroccoNepalNetherlandsNicaraguaNigeriaNorth AmericaNorth MacedoniaNorthern AfricaNorthern EuropeNorwayOceaniaPakistanPanamaPeruPhilippinesPolandPortugalRomaniaRussiaSaudi ArabiaScotlandSenegalSerbiaSierra LeoneSingaporeSomaliaSouth AfricaSouth AmericaSouth Central AsiaSouth Eastern AsiaSouthern EuropeSpainSri LankaSt. Vincent and the GrenadinesSudanSwedenSwitzerlandSyriaTaiwanThailandTrinidad and TobagoTurkeyUgandaUkraineUruguayUzbekistanVenezuelaVietnamWest IndiesWestern AfricaWestern AsiaWestern EuropeYemenZaireZimbabweAzores
Master's Degree
Income
Poverty
Unemployment
Labor Participation
Family Structure
Vehicle Availability
Education Level
Disability

Master's Degree Comparison

Shoshone

Immigrants from the Azores

Tragic
Tragic
11.1%
MASTER'S DEGREE
0.0/ 100
METRIC RATING
310th/ 347
METRIC RANK
10.2%
MASTER'S DEGREE
0.0/ 100
METRIC RATING
332nd/ 347
METRIC RANK

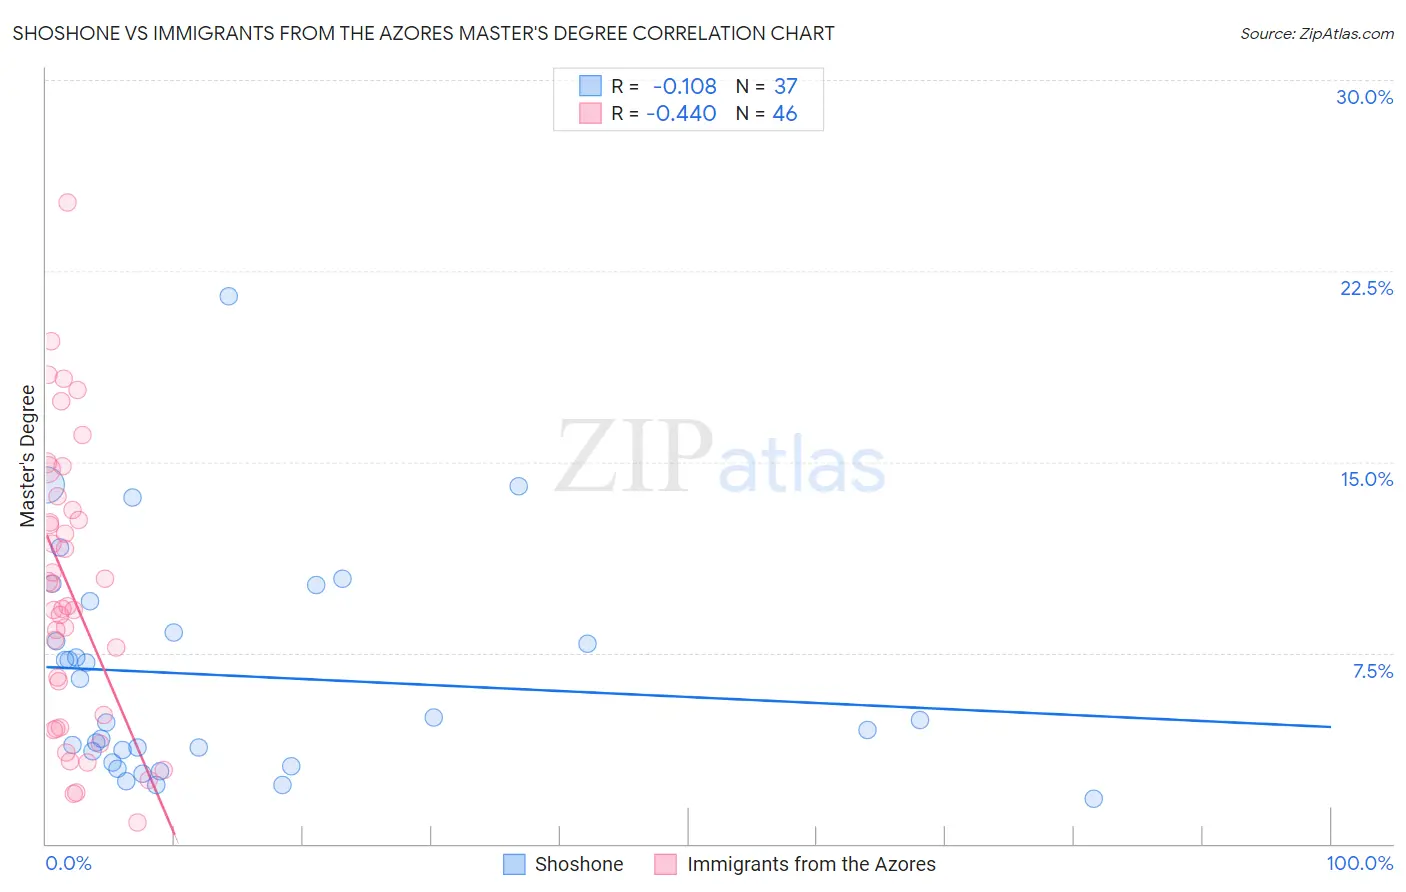
Shoshone vs Immigrants from the Azores Master's Degree Correlation Chart

The statistical analysis conducted on geographies consisting of 66,620,223 people shows a poor negative correlation between the proportion of Shoshone and percentage of population with at least master's degree education in the United States with a correlation coefficient (R) of -0.108 and weighted average of 11.1%. Similarly, the statistical analysis conducted on geographies consisting of 46,256,023 people shows a moderate negative correlation between the proportion of Immigrants from the Azores and percentage of population with at least master's degree education in the United States with a correlation coefficient (R) of -0.440 and weighted average of 10.2%, a difference of 8.5%.
Shoshone vs Immigrants from the Azores Master's Degree

Master's Degree Correlation Summary

MeasurementShoshoneImmigrants from the Azores
Minimum1.8%0.81%
Maximum21.5%25.2%
Range19.7%24.4%
Mean6.6%9.9%
Median4.9%9.3%
Interquartile 25% (IQ1)3.4%4.6%
Interquartile 75% (IQ3)8.9%13.1%
Interquartile Range (IQR)5.5%8.5%
Standard Deviation (Sample)4.3%5.6%
Standard Deviation (Population)4.3%5.5%

Similar Demographics by Master's Degree

Demographics Similar to Shoshone by Master's Degree

In terms of master's degree, the demographic groups most similar to Shoshone are Puget Sound Salish (11.1%, a difference of 0.36%), Seminole (11.0%, a difference of 0.51%), Choctaw (11.0%, a difference of 0.61%), Puerto Rican (11.2%, a difference of 0.65%), and Yaqui (11.0%, a difference of 0.79%).
DemographicsRating | RankMaster's Degree
Immigrants | Laos
0.1
/100
|
#303
Tragic
11.4%
Immigrants | Cabo Verde
0.1
/100
|
#304
Tragic
11.3%
Immigrants | Latin America
0.0
/100
|
#305
Tragic
11.3%
Mexican American Indians
0.0
/100
|
#306
Tragic
11.2%
Cheyenne
0.0
/100
|
#307
Tragic
11.2%
Puerto Ricans
0.0
/100
|
#308
Tragic
11.2%
Puget Sound Salish
0.0
/100
|
#309
Tragic
11.1%
Shoshone
0.0
/100
|
#310
Tragic
11.1%
Seminole
0.0
/100
|
#311
Tragic
11.0%
Choctaw
0.0
/100
|
#312
Tragic
11.0%
Yaqui
0.0
/100
|
#313
Tragic
11.0%
Cajuns
0.0
/100
|
#314
Tragic
11.0%
Apache
0.0
/100
|
#315
Tragic
11.0%
Hispanics or Latinos
0.0
/100
|
#316
Tragic
10.9%
Hopi
0.0
/100
|
#317
Tragic
10.9%

Demographics Similar to Immigrants from the Azores by Master's Degree

In terms of master's degree, the demographic groups most similar to Immigrants from the Azores are Menominee (10.2%, a difference of 0.37%), Pueblo (10.3%, a difference of 0.46%), Fijian (10.3%, a difference of 0.63%), Arapaho (10.0%, a difference of 2.3%), and Nepalese (10.5%, a difference of 2.4%).
DemographicsRating | RankMaster's Degree
Inupiat
0.0
/100
|
#325
Tragic
10.5%
Creek
0.0
/100
|
#326
Tragic
10.5%
Paiute
0.0
/100
|
#327
Tragic
10.5%
Bangladeshis
0.0
/100
|
#328
Tragic
10.5%
Nepalese
0.0
/100
|
#329
Tragic
10.5%
Fijians
0.0
/100
|
#330
Tragic
10.3%
Pueblo
0.0
/100
|
#331
Tragic
10.3%
Immigrants | Azores
0.0
/100
|
#332
Tragic
10.2%
Menominee
0.0
/100
|
#333
Tragic
10.2%
Arapaho
0.0
/100
|
#334
Tragic
10.0%
Immigrants | Central America
0.0
/100
|
#335
Tragic
10.0%
Natives/Alaskans
0.0
/100
|
#336
Tragic
9.9%
Mexicans
0.0
/100
|
#337
Tragic
9.7%
Tohono O'odham
0.0
/100
|
#338
Tragic
9.7%
Spanish American Indians
0.0
/100
|
#339
Tragic
9.6%