Shoshone vs Immigrants from Turkey Associate's Degree
COMPARE
Shoshone
Immigrants from Turkey
Associate's Degree
Associate's Degree Comparison
Shoshone
Immigrants from Turkey
38.4%
ASSOCIATE'S DEGREE
0.0/ 100
METRIC RATING
306th/ 347
METRIC RANK
53.4%
ASSOCIATE'S DEGREE
100.0/ 100
METRIC RATING
32nd/ 347
METRIC RANK
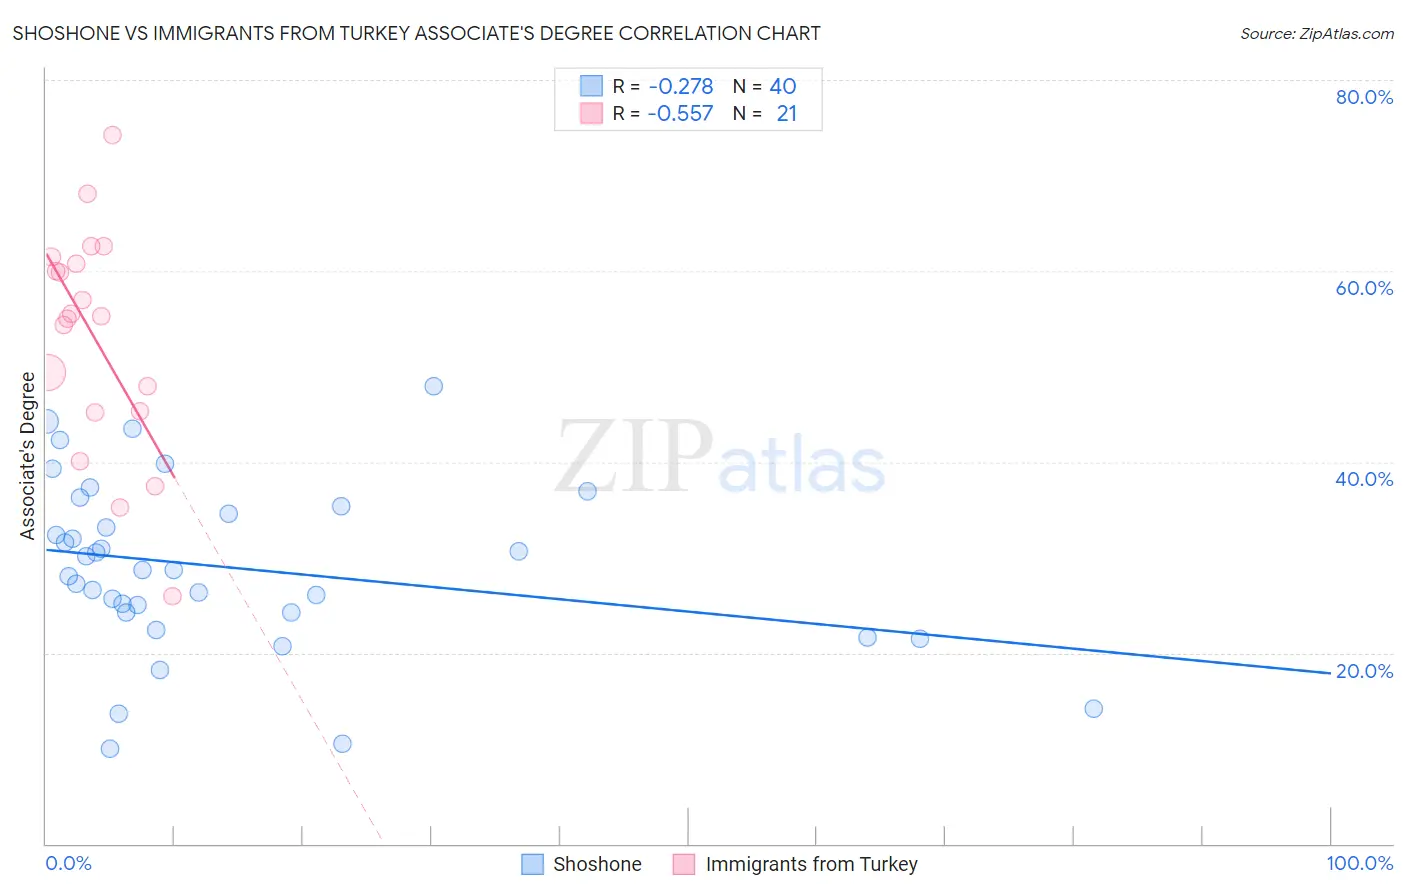
Shoshone vs Immigrants from Turkey Associate's Degree Correlation Chart
The statistical analysis conducted on geographies consisting of 66,627,351 people shows a weak negative correlation between the proportion of Shoshone and percentage of population with at least associate's degree education in the United States with a correlation coefficient (R) of -0.278 and weighted average of 38.4%. Similarly, the statistical analysis conducted on geographies consisting of 223,053,786 people shows a substantial negative correlation between the proportion of Immigrants from Turkey and percentage of population with at least associate's degree education in the United States with a correlation coefficient (R) of -0.557 and weighted average of 53.4%, a difference of 39.1%.
Associate's Degree Correlation Summary
| Measurement | Shoshone | Immigrants from Turkey |
| Minimum | 9.9% | 26.0% |
| Maximum | 47.9% | 74.2% |
| Range | 38.0% | 48.2% |
| Mean | 28.9% | 53.0% |
| Median | 28.7% | 55.2% |
| Interquartile 25% (IQ1) | 24.2% | 45.2% |
| Interquartile 75% (IQ3) | 35.0% | 61.1% |
| Interquartile Range (IQR) | 10.7% | 15.9% |
| Standard Deviation (Sample) | 9.0% | 11.7% |
| Standard Deviation (Population) | 8.8% | 11.4% |
Similar Demographics by Associate's Degree
Demographics Similar to Shoshone by Associate's Degree
In terms of associate's degree, the demographic groups most similar to Shoshone are Immigrants from El Salvador (38.4%, a difference of 0.040%), Immigrants from Honduras (38.5%, a difference of 0.070%), Sioux (38.5%, a difference of 0.13%), Guatemalan (38.5%, a difference of 0.19%), and Colville (38.5%, a difference of 0.27%).
| Demographics | Rating | Rank | Associate's Degree |
| Ute | 0.0 /100 | #299 | Tragic 38.6% |
| Chickasaw | 0.0 /100 | #300 | Tragic 38.6% |
| Tsimshian | 0.0 /100 | #301 | Tragic 38.6% |
| Colville | 0.0 /100 | #302 | Tragic 38.5% |
| Guatemalans | 0.0 /100 | #303 | Tragic 38.5% |
| Sioux | 0.0 /100 | #304 | Tragic 38.5% |
| Immigrants | Honduras | 0.0 /100 | #305 | Tragic 38.5% |
| Shoshone | 0.0 /100 | #306 | Tragic 38.4% |
| Immigrants | El Salvador | 0.0 /100 | #307 | Tragic 38.4% |
| Mexican American Indians | 0.0 /100 | #308 | Tragic 38.2% |
| Immigrants | Guatemala | 0.0 /100 | #309 | Tragic 38.1% |
| Immigrants | Dominican Republic | 0.0 /100 | #310 | Tragic 37.9% |
| Immigrants | Latin America | 0.0 /100 | #311 | Tragic 37.9% |
| Choctaw | 0.0 /100 | #312 | Tragic 37.8% |
| Hispanics or Latinos | 0.0 /100 | #313 | Tragic 37.7% |
Demographics Similar to Immigrants from Turkey by Associate's Degree
In terms of associate's degree, the demographic groups most similar to Immigrants from Turkey are Immigrants from Northern Europe (53.5%, a difference of 0.030%), Israeli (53.4%, a difference of 0.12%), Bulgarian (53.3%, a difference of 0.31%), Russian (53.2%, a difference of 0.38%), and Immigrants from Sri Lanka (53.7%, a difference of 0.39%).
| Demographics | Rating | Rank | Associate's Degree |
| Immigrants | Switzerland | 100.0 /100 | #25 | Exceptional 54.5% |
| Immigrants | Belgium | 100.0 /100 | #26 | Exceptional 54.5% |
| Latvians | 100.0 /100 | #27 | Exceptional 53.9% |
| Turks | 100.0 /100 | #28 | Exceptional 53.9% |
| Immigrants | France | 100.0 /100 | #29 | Exceptional 53.9% |
| Immigrants | Sri Lanka | 100.0 /100 | #30 | Exceptional 53.7% |
| Immigrants | Northern Europe | 100.0 /100 | #31 | Exceptional 53.5% |
| Immigrants | Turkey | 100.0 /100 | #32 | Exceptional 53.4% |
| Israelis | 100.0 /100 | #33 | Exceptional 53.4% |
| Bulgarians | 100.0 /100 | #34 | Exceptional 53.3% |
| Russians | 100.0 /100 | #35 | Exceptional 53.2% |
| Immigrants | Russia | 100.0 /100 | #36 | Exceptional 53.1% |
| Immigrants | Denmark | 100.0 /100 | #37 | Exceptional 53.1% |
| Mongolians | 100.0 /100 | #38 | Exceptional 53.0% |
| Immigrants | Belarus | 99.9 /100 | #39 | Exceptional 52.8% |