Estonian vs Immigrants from the Azores Associate's Degree
COMPARE
Estonian
Immigrants from the Azores
Associate's Degree
Associate's Degree Comparison
Estonians
Immigrants from the Azores
52.5%
ASSOCIATE'S DEGREE
99.9/ 100
METRIC RATING
44th/ 347
METRIC RANK
35.6%
ASSOCIATE'S DEGREE
0.0/ 100
METRIC RATING
331st/ 347
METRIC RANK
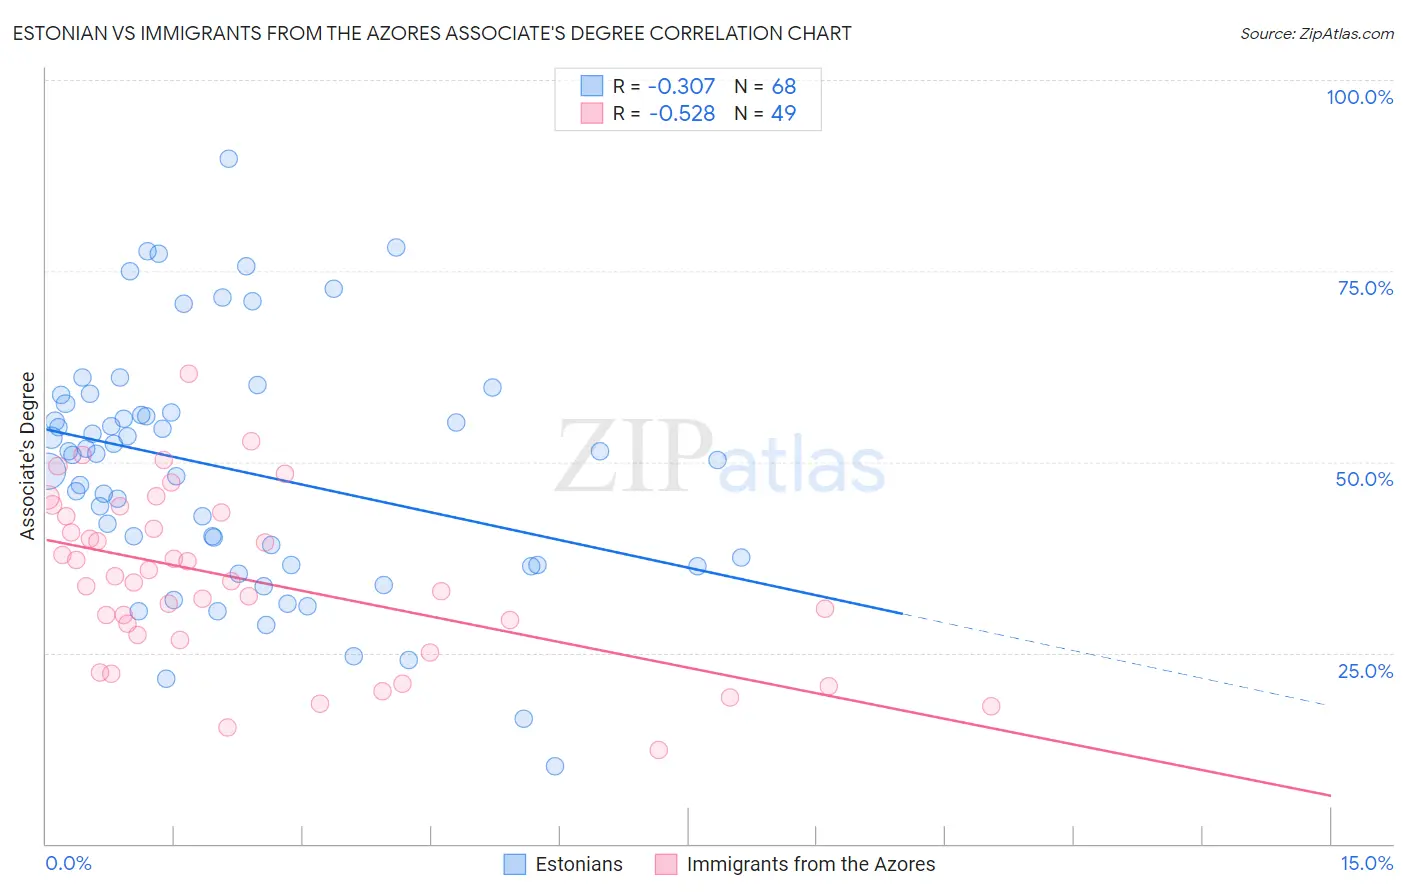
Estonian vs Immigrants from the Azores Associate's Degree Correlation Chart
The statistical analysis conducted on geographies consisting of 123,528,324 people shows a mild negative correlation between the proportion of Estonians and percentage of population with at least associate's degree education in the United States with a correlation coefficient (R) of -0.307 and weighted average of 52.5%. Similarly, the statistical analysis conducted on geographies consisting of 46,257,310 people shows a substantial negative correlation between the proportion of Immigrants from the Azores and percentage of population with at least associate's degree education in the United States with a correlation coefficient (R) of -0.528 and weighted average of 35.6%, a difference of 47.2%.
Associate's Degree Correlation Summary
| Measurement | Estonian | Immigrants from the Azores |
| Minimum | 10.2% | 12.3% |
| Maximum | 89.7% | 61.6% |
| Range | 79.5% | 49.2% |
| Mean | 49.0% | 34.6% |
| Median | 51.0% | 34.4% |
| Interquartile 25% (IQ1) | 36.5% | 27.0% |
| Interquartile 75% (IQ3) | 57.1% | 43.1% |
| Interquartile Range (IQR) | 20.5% | 16.1% |
| Standard Deviation (Sample) | 16.0% | 11.0% |
| Standard Deviation (Population) | 15.9% | 10.9% |
Similar Demographics by Associate's Degree
Demographics Similar to Estonians by Associate's Degree
In terms of associate's degree, the demographic groups most similar to Estonians are Immigrants from Lithuania (52.4%, a difference of 0.080%), Immigrants from South Africa (52.5%, a difference of 0.090%), Immigrants from Malaysia (52.5%, a difference of 0.10%), Immigrants from Saudi Arabia (52.6%, a difference of 0.13%), and Immigrants from Bulgaria (52.4%, a difference of 0.21%).
| Demographics | Rating | Rank | Associate's Degree |
| Immigrants | Denmark | 100.0 /100 | #37 | Exceptional 53.1% |
| Mongolians | 100.0 /100 | #38 | Exceptional 53.0% |
| Immigrants | Belarus | 99.9 /100 | #39 | Exceptional 52.8% |
| Immigrants | Latvia | 99.9 /100 | #40 | Exceptional 52.8% |
| Immigrants | Saudi Arabia | 99.9 /100 | #41 | Exceptional 52.6% |
| Immigrants | Malaysia | 99.9 /100 | #42 | Exceptional 52.5% |
| Immigrants | South Africa | 99.9 /100 | #43 | Exceptional 52.5% |
| Estonians | 99.9 /100 | #44 | Exceptional 52.5% |
| Immigrants | Lithuania | 99.9 /100 | #45 | Exceptional 52.4% |
| Immigrants | Bulgaria | 99.9 /100 | #46 | Exceptional 52.4% |
| Immigrants | Kuwait | 99.9 /100 | #47 | Exceptional 52.4% |
| Immigrants | Norway | 99.9 /100 | #48 | Exceptional 52.2% |
| Immigrants | Austria | 99.9 /100 | #49 | Exceptional 52.1% |
| Asians | 99.9 /100 | #50 | Exceptional 52.1% |
| Immigrants | Greece | 99.9 /100 | #51 | Exceptional 52.1% |
Demographics Similar to Immigrants from the Azores by Associate's Degree
In terms of associate's degree, the demographic groups most similar to Immigrants from the Azores are Apache (36.2%, a difference of 1.7%), Immigrants from Central America (35.0%, a difference of 1.8%), Mexican (35.0%, a difference of 1.9%), Paiute (36.4%, a difference of 2.0%), and Native/Alaskan (34.9%, a difference of 2.1%).
| Demographics | Rating | Rank | Associate's Degree |
| Arapaho | 0.0 /100 | #324 | Tragic 36.7% |
| Menominee | 0.0 /100 | #325 | Tragic 36.7% |
| Kiowa | 0.0 /100 | #326 | Tragic 36.5% |
| Dutch West Indians | 0.0 /100 | #327 | Tragic 36.5% |
| Alaskan Athabascans | 0.0 /100 | #328 | Tragic 36.5% |
| Paiute | 0.0 /100 | #329 | Tragic 36.4% |
| Apache | 0.0 /100 | #330 | Tragic 36.2% |
| Immigrants | Azores | 0.0 /100 | #331 | Tragic 35.6% |
| Immigrants | Central America | 0.0 /100 | #332 | Tragic 35.0% |
| Mexicans | 0.0 /100 | #333 | Tragic 35.0% |
| Natives/Alaskans | 0.0 /100 | #334 | Tragic 34.9% |
| Spanish American Indians | 0.0 /100 | #335 | Tragic 34.9% |
| Hopi | 0.0 /100 | #336 | Tragic 34.6% |
| Lumbee | 0.0 /100 | #337 | Tragic 34.1% |
| Pueblo | 0.0 /100 | #338 | Tragic 34.0% |