Celtic vs Immigrants from the Azores Associate's Degree
COMPARE
Celtic
Immigrants from the Azores
Associate's Degree
Associate's Degree Comparison
Celtics
Immigrants from the Azores
45.8%
ASSOCIATE'S DEGREE
33.3/ 100
METRIC RATING
192nd/ 347
METRIC RANK
35.6%
ASSOCIATE'S DEGREE
0.0/ 100
METRIC RATING
331st/ 347
METRIC RANK
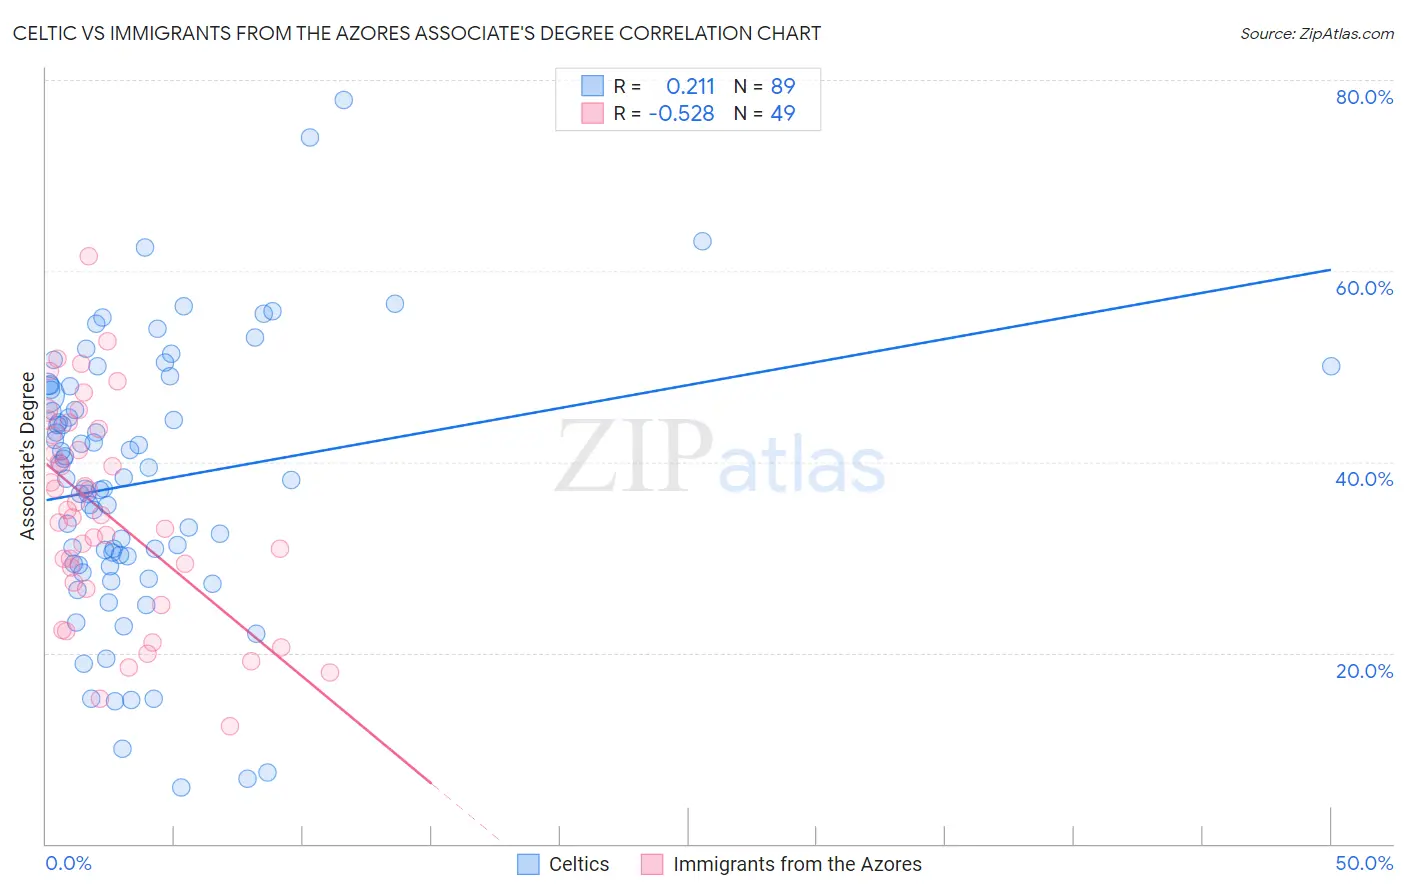
Celtic vs Immigrants from the Azores Associate's Degree Correlation Chart
The statistical analysis conducted on geographies consisting of 168,877,276 people shows a weak positive correlation between the proportion of Celtics and percentage of population with at least associate's degree education in the United States with a correlation coefficient (R) of 0.211 and weighted average of 45.8%. Similarly, the statistical analysis conducted on geographies consisting of 46,257,310 people shows a substantial negative correlation between the proportion of Immigrants from the Azores and percentage of population with at least associate's degree education in the United States with a correlation coefficient (R) of -0.528 and weighted average of 35.6%, a difference of 28.4%.
Associate's Degree Correlation Summary
| Measurement | Celtic | Immigrants from the Azores |
| Minimum | 5.9% | 12.3% |
| Maximum | 77.9% | 61.6% |
| Range | 72.0% | 49.2% |
| Mean | 37.9% | 34.6% |
| Median | 38.3% | 34.4% |
| Interquartile 25% (IQ1) | 29.3% | 27.0% |
| Interquartile 75% (IQ3) | 47.8% | 43.1% |
| Interquartile Range (IQR) | 18.5% | 16.1% |
| Standard Deviation (Sample) | 14.1% | 11.0% |
| Standard Deviation (Population) | 14.0% | 10.9% |
Similar Demographics by Associate's Degree
Demographics Similar to Celtics by Associate's Degree
In terms of associate's degree, the demographic groups most similar to Celtics are Korean (45.8%, a difference of 0.050%), Vietnamese (45.8%, a difference of 0.060%), Immigrants from Oceania (45.8%, a difference of 0.12%), Immigrants from Uruguay (45.8%, a difference of 0.18%), and Ghanaian (45.8%, a difference of 0.18%).
| Demographics | Rating | Rank | Associate's Degree |
| Costa Ricans | 38.6 /100 | #185 | Fair 46.0% |
| Welsh | 37.9 /100 | #186 | Fair 45.9% |
| Immigrants | Uruguay | 35.5 /100 | #187 | Fair 45.8% |
| Ghanaians | 35.5 /100 | #188 | Fair 45.8% |
| Immigrants | Oceania | 34.7 /100 | #189 | Fair 45.8% |
| Vietnamese | 34.0 /100 | #190 | Fair 45.8% |
| Koreans | 33.8 /100 | #191 | Fair 45.8% |
| Celtics | 33.3 /100 | #192 | Fair 45.8% |
| Immigrants | Cameroon | 31.0 /100 | #193 | Fair 45.7% |
| Immigrants | Peru | 27.6 /100 | #194 | Fair 45.5% |
| Germans | 26.5 /100 | #195 | Fair 45.5% |
| French | 25.6 /100 | #196 | Fair 45.4% |
| Scotch-Irish | 22.3 /100 | #197 | Fair 45.3% |
| Immigrants | Bangladesh | 21.3 /100 | #198 | Fair 45.2% |
| Immigrants | Senegal | 21.2 /100 | #199 | Fair 45.2% |
Demographics Similar to Immigrants from the Azores by Associate's Degree
In terms of associate's degree, the demographic groups most similar to Immigrants from the Azores are Apache (36.2%, a difference of 1.7%), Immigrants from Central America (35.0%, a difference of 1.8%), Mexican (35.0%, a difference of 1.9%), Paiute (36.4%, a difference of 2.0%), and Native/Alaskan (34.9%, a difference of 2.1%).
| Demographics | Rating | Rank | Associate's Degree |
| Arapaho | 0.0 /100 | #324 | Tragic 36.7% |
| Menominee | 0.0 /100 | #325 | Tragic 36.7% |
| Kiowa | 0.0 /100 | #326 | Tragic 36.5% |
| Dutch West Indians | 0.0 /100 | #327 | Tragic 36.5% |
| Alaskan Athabascans | 0.0 /100 | #328 | Tragic 36.5% |
| Paiute | 0.0 /100 | #329 | Tragic 36.4% |
| Apache | 0.0 /100 | #330 | Tragic 36.2% |
| Immigrants | Azores | 0.0 /100 | #331 | Tragic 35.6% |
| Immigrants | Central America | 0.0 /100 | #332 | Tragic 35.0% |
| Mexicans | 0.0 /100 | #333 | Tragic 35.0% |
| Natives/Alaskans | 0.0 /100 | #334 | Tragic 34.9% |
| Spanish American Indians | 0.0 /100 | #335 | Tragic 34.9% |
| Hopi | 0.0 /100 | #336 | Tragic 34.6% |
| Lumbee | 0.0 /100 | #337 | Tragic 34.1% |
| Pueblo | 0.0 /100 | #338 | Tragic 34.0% |