Shoshone vs Immigrants from Lithuania Associate's Degree
COMPARE
Shoshone
Immigrants from Lithuania
Associate's Degree
Associate's Degree Comparison
Shoshone
Immigrants from Lithuania
38.4%
ASSOCIATE'S DEGREE
0.0/ 100
METRIC RATING
306th/ 347
METRIC RANK
52.4%
ASSOCIATE'S DEGREE
99.9/ 100
METRIC RATING
45th/ 347
METRIC RANK
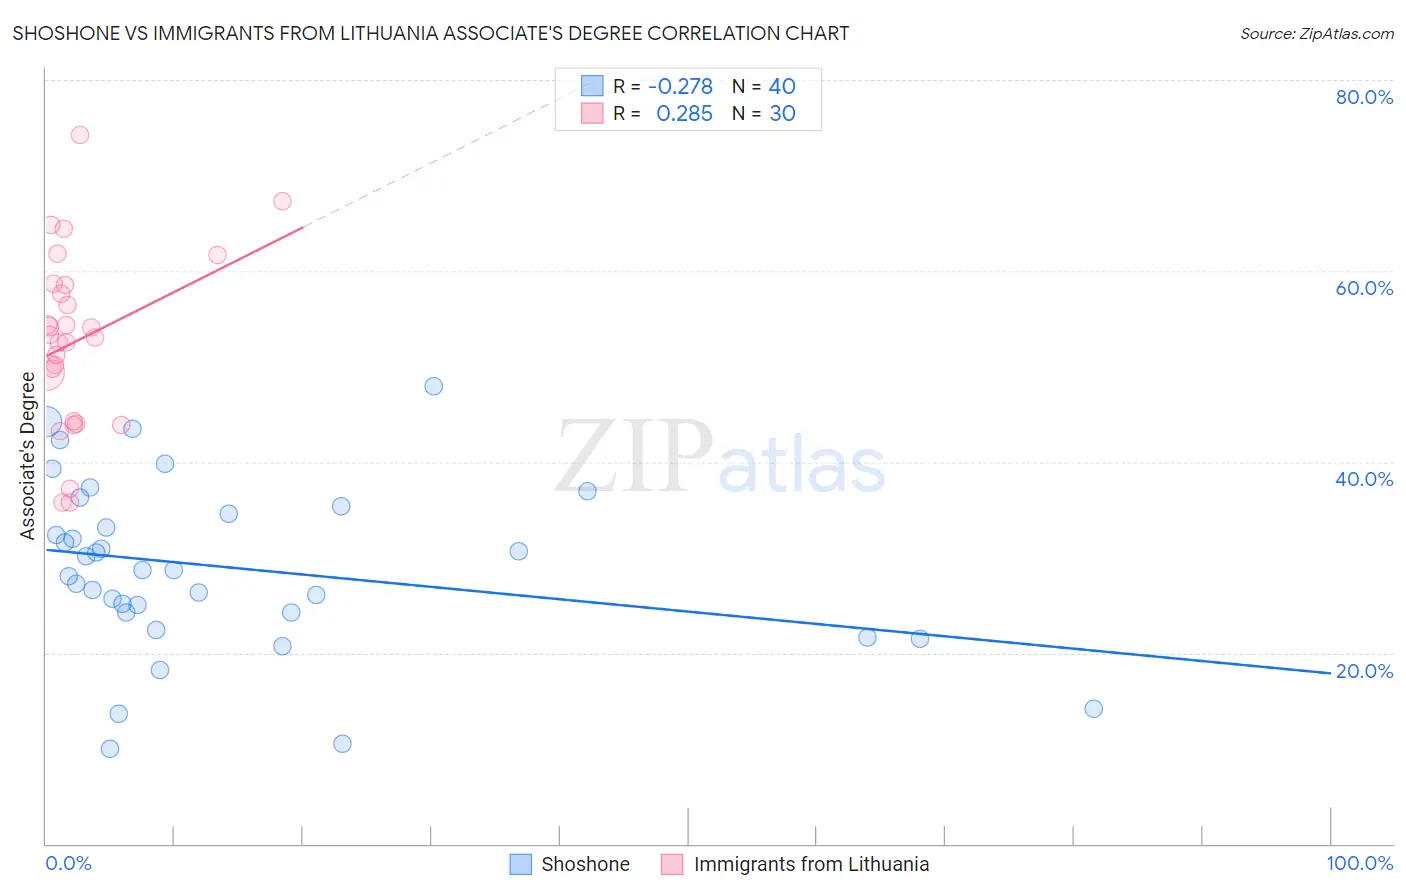
Shoshone vs Immigrants from Lithuania Associate's Degree Correlation Chart
The statistical analysis conducted on geographies consisting of 66,627,351 people shows a weak negative correlation between the proportion of Shoshone and percentage of population with at least associate's degree education in the United States with a correlation coefficient (R) of -0.278 and weighted average of 38.4%. Similarly, the statistical analysis conducted on geographies consisting of 117,722,731 people shows a weak positive correlation between the proportion of Immigrants from Lithuania and percentage of population with at least associate's degree education in the United States with a correlation coefficient (R) of 0.285 and weighted average of 52.4%, a difference of 36.5%.
Associate's Degree Correlation Summary
| Measurement | Shoshone | Immigrants from Lithuania |
| Minimum | 9.9% | 35.7% |
| Maximum | 47.9% | 74.3% |
| Range | 38.0% | 38.5% |
| Mean | 28.9% | 52.7% |
| Median | 28.7% | 53.2% |
| Interquartile 25% (IQ1) | 24.2% | 44.2% |
| Interquartile 75% (IQ3) | 35.0% | 58.5% |
| Interquartile Range (IQR) | 10.7% | 14.3% |
| Standard Deviation (Sample) | 9.0% | 9.2% |
| Standard Deviation (Population) | 8.8% | 9.1% |
Similar Demographics by Associate's Degree
Demographics Similar to Shoshone by Associate's Degree
In terms of associate's degree, the demographic groups most similar to Shoshone are Immigrants from El Salvador (38.4%, a difference of 0.040%), Immigrants from Honduras (38.5%, a difference of 0.070%), Sioux (38.5%, a difference of 0.13%), Guatemalan (38.5%, a difference of 0.19%), and Colville (38.5%, a difference of 0.27%).
| Demographics | Rating | Rank | Associate's Degree |
| Ute | 0.0 /100 | #299 | Tragic 38.6% |
| Chickasaw | 0.0 /100 | #300 | Tragic 38.6% |
| Tsimshian | 0.0 /100 | #301 | Tragic 38.6% |
| Colville | 0.0 /100 | #302 | Tragic 38.5% |
| Guatemalans | 0.0 /100 | #303 | Tragic 38.5% |
| Sioux | 0.0 /100 | #304 | Tragic 38.5% |
| Immigrants | Honduras | 0.0 /100 | #305 | Tragic 38.5% |
| Shoshone | 0.0 /100 | #306 | Tragic 38.4% |
| Immigrants | El Salvador | 0.0 /100 | #307 | Tragic 38.4% |
| Mexican American Indians | 0.0 /100 | #308 | Tragic 38.2% |
| Immigrants | Guatemala | 0.0 /100 | #309 | Tragic 38.1% |
| Immigrants | Dominican Republic | 0.0 /100 | #310 | Tragic 37.9% |
| Immigrants | Latin America | 0.0 /100 | #311 | Tragic 37.9% |
| Choctaw | 0.0 /100 | #312 | Tragic 37.8% |
| Hispanics or Latinos | 0.0 /100 | #313 | Tragic 37.7% |
Demographics Similar to Immigrants from Lithuania by Associate's Degree
In terms of associate's degree, the demographic groups most similar to Immigrants from Lithuania are Estonian (52.5%, a difference of 0.080%), Immigrants from Bulgaria (52.4%, a difference of 0.13%), Immigrants from Kuwait (52.4%, a difference of 0.14%), Immigrants from South Africa (52.5%, a difference of 0.16%), and Immigrants from Malaysia (52.5%, a difference of 0.17%).
| Demographics | Rating | Rank | Associate's Degree |
| Mongolians | 100.0 /100 | #38 | Exceptional 53.0% |
| Immigrants | Belarus | 99.9 /100 | #39 | Exceptional 52.8% |
| Immigrants | Latvia | 99.9 /100 | #40 | Exceptional 52.8% |
| Immigrants | Saudi Arabia | 99.9 /100 | #41 | Exceptional 52.6% |
| Immigrants | Malaysia | 99.9 /100 | #42 | Exceptional 52.5% |
| Immigrants | South Africa | 99.9 /100 | #43 | Exceptional 52.5% |
| Estonians | 99.9 /100 | #44 | Exceptional 52.5% |
| Immigrants | Lithuania | 99.9 /100 | #45 | Exceptional 52.4% |
| Immigrants | Bulgaria | 99.9 /100 | #46 | Exceptional 52.4% |
| Immigrants | Kuwait | 99.9 /100 | #47 | Exceptional 52.4% |
| Immigrants | Norway | 99.9 /100 | #48 | Exceptional 52.2% |
| Immigrants | Austria | 99.9 /100 | #49 | Exceptional 52.1% |
| Asians | 99.9 /100 | #50 | Exceptional 52.1% |
| Immigrants | Greece | 99.9 /100 | #51 | Exceptional 52.1% |
| Bolivians | 99.8 /100 | #52 | Exceptional 52.0% |