Slovene vs Immigrants from the Azores Associate's Degree
COMPARE
Slovene
Immigrants from the Azores
Associate's Degree
Associate's Degree Comparison
Slovenes
Immigrants from the Azores
47.9%
ASSOCIATE'S DEGREE
85.1/ 100
METRIC RATING
139th/ 347
METRIC RANK
35.6%
ASSOCIATE'S DEGREE
0.0/ 100
METRIC RATING
331st/ 347
METRIC RANK
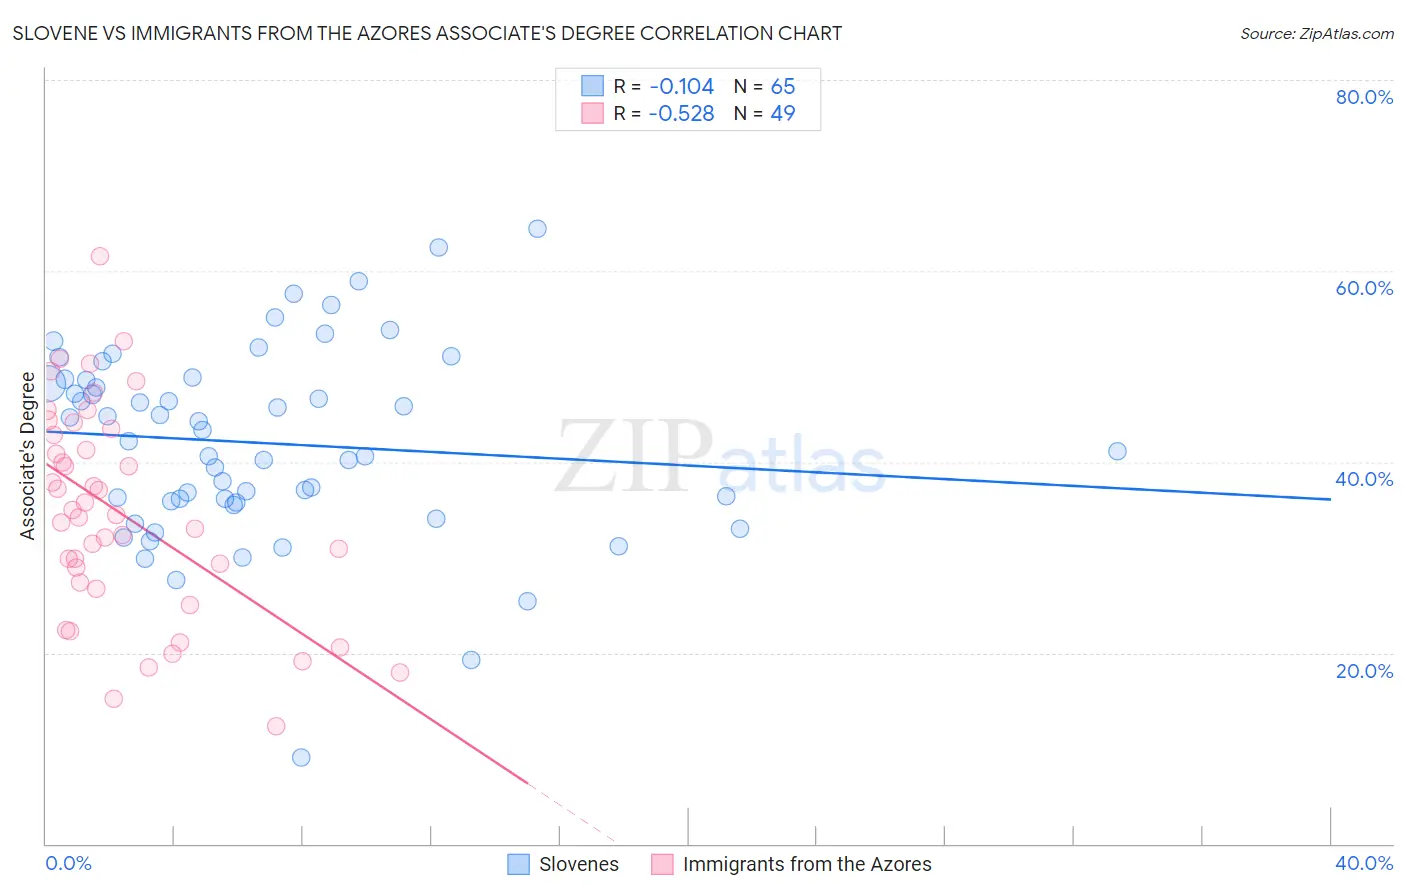
Slovene vs Immigrants from the Azores Associate's Degree Correlation Chart
The statistical analysis conducted on geographies consisting of 261,343,960 people shows a poor negative correlation between the proportion of Slovenes and percentage of population with at least associate's degree education in the United States with a correlation coefficient (R) of -0.104 and weighted average of 47.9%. Similarly, the statistical analysis conducted on geographies consisting of 46,257,310 people shows a substantial negative correlation between the proportion of Immigrants from the Azores and percentage of population with at least associate's degree education in the United States with a correlation coefficient (R) of -0.528 and weighted average of 35.6%, a difference of 34.3%.
Associate's Degree Correlation Summary
| Measurement | Slovene | Immigrants from the Azores |
| Minimum | 9.0% | 12.3% |
| Maximum | 64.4% | 61.6% |
| Range | 55.4% | 49.2% |
| Mean | 42.0% | 34.6% |
| Median | 42.1% | 34.4% |
| Interquartile 25% (IQ1) | 35.8% | 27.0% |
| Interquartile 75% (IQ3) | 48.6% | 43.1% |
| Interquartile Range (IQR) | 12.8% | 16.1% |
| Standard Deviation (Sample) | 10.1% | 11.0% |
| Standard Deviation (Population) | 10.0% | 10.9% |
Similar Demographics by Associate's Degree
Demographics Similar to Slovenes by Associate's Degree
In terms of associate's degree, the demographic groups most similar to Slovenes are Immigrants from Southern Europe (47.8%, a difference of 0.090%), Taiwanese (47.7%, a difference of 0.24%), Sierra Leonean (47.7%, a difference of 0.30%), Polish (48.0%, a difference of 0.35%), and Immigrants from Eritrea (48.1%, a difference of 0.42%).
| Demographics | Rating | Rank | Associate's Degree |
| Immigrants | Albania | 89.9 /100 | #132 | Excellent 48.2% |
| Assyrians/Chaldeans/Syriacs | 89.4 /100 | #133 | Excellent 48.2% |
| Moroccans | 89.3 /100 | #134 | Excellent 48.2% |
| Europeans | 89.0 /100 | #135 | Excellent 48.2% |
| Pakistanis | 88.0 /100 | #136 | Excellent 48.1% |
| Immigrants | Eritrea | 87.8 /100 | #137 | Excellent 48.1% |
| Poles | 87.3 /100 | #138 | Excellent 48.0% |
| Slovenes | 85.1 /100 | #139 | Excellent 47.9% |
| Immigrants | Southern Europe | 84.4 /100 | #140 | Excellent 47.8% |
| Taiwanese | 83.3 /100 | #141 | Excellent 47.7% |
| Sierra Leoneans | 82.9 /100 | #142 | Excellent 47.7% |
| Norwegians | 81.0 /100 | #143 | Excellent 47.6% |
| Slavs | 80.5 /100 | #144 | Excellent 47.6% |
| Canadians | 79.0 /100 | #145 | Good 47.5% |
| Immigrants | Sudan | 77.9 /100 | #146 | Good 47.4% |
Demographics Similar to Immigrants from the Azores by Associate's Degree
In terms of associate's degree, the demographic groups most similar to Immigrants from the Azores are Apache (36.2%, a difference of 1.7%), Immigrants from Central America (35.0%, a difference of 1.8%), Mexican (35.0%, a difference of 1.9%), Paiute (36.4%, a difference of 2.0%), and Native/Alaskan (34.9%, a difference of 2.1%).
| Demographics | Rating | Rank | Associate's Degree |
| Arapaho | 0.0 /100 | #324 | Tragic 36.7% |
| Menominee | 0.0 /100 | #325 | Tragic 36.7% |
| Kiowa | 0.0 /100 | #326 | Tragic 36.5% |
| Dutch West Indians | 0.0 /100 | #327 | Tragic 36.5% |
| Alaskan Athabascans | 0.0 /100 | #328 | Tragic 36.5% |
| Paiute | 0.0 /100 | #329 | Tragic 36.4% |
| Apache | 0.0 /100 | #330 | Tragic 36.2% |
| Immigrants | Azores | 0.0 /100 | #331 | Tragic 35.6% |
| Immigrants | Central America | 0.0 /100 | #332 | Tragic 35.0% |
| Mexicans | 0.0 /100 | #333 | Tragic 35.0% |
| Natives/Alaskans | 0.0 /100 | #334 | Tragic 34.9% |
| Spanish American Indians | 0.0 /100 | #335 | Tragic 34.9% |
| Hopi | 0.0 /100 | #336 | Tragic 34.6% |
| Lumbee | 0.0 /100 | #337 | Tragic 34.1% |
| Pueblo | 0.0 /100 | #338 | Tragic 34.0% |