Shoshone vs Immigrants from Poland Associate's Degree
COMPARE
Shoshone
Immigrants from Poland
Associate's Degree
Associate's Degree Comparison
Shoshone
Immigrants from Poland
38.4%
ASSOCIATE'S DEGREE
0.0/ 100
METRIC RATING
306th/ 347
METRIC RANK
47.1%
ASSOCIATE'S DEGREE
69.2/ 100
METRIC RATING
159th/ 347
METRIC RANK
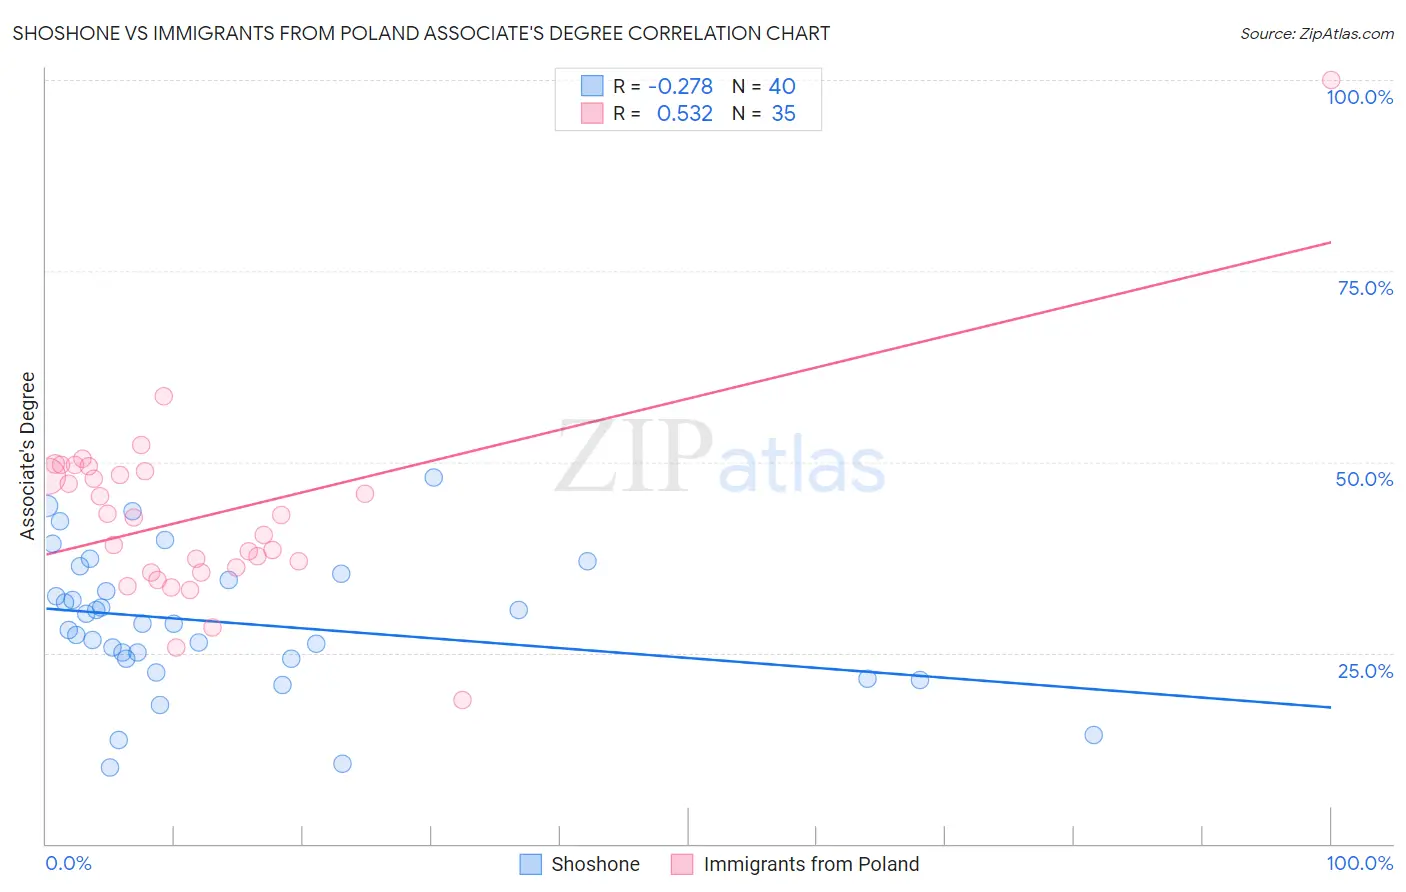
Shoshone vs Immigrants from Poland Associate's Degree Correlation Chart
The statistical analysis conducted on geographies consisting of 66,627,351 people shows a weak negative correlation between the proportion of Shoshone and percentage of population with at least associate's degree education in the United States with a correlation coefficient (R) of -0.278 and weighted average of 38.4%. Similarly, the statistical analysis conducted on geographies consisting of 304,854,598 people shows a substantial positive correlation between the proportion of Immigrants from Poland and percentage of population with at least associate's degree education in the United States with a correlation coefficient (R) of 0.532 and weighted average of 47.1%, a difference of 22.5%.
Associate's Degree Correlation Summary
| Measurement | Shoshone | Immigrants from Poland |
| Minimum | 9.9% | 18.8% |
| Maximum | 47.9% | 100.0% |
| Range | 38.0% | 81.2% |
| Mean | 28.9% | 42.9% |
| Median | 28.7% | 42.8% |
| Interquartile 25% (IQ1) | 24.2% | 35.5% |
| Interquartile 75% (IQ3) | 35.0% | 48.8% |
| Interquartile Range (IQR) | 10.7% | 13.2% |
| Standard Deviation (Sample) | 9.0% | 13.0% |
| Standard Deviation (Population) | 8.8% | 12.8% |
Similar Demographics by Associate's Degree
Demographics Similar to Shoshone by Associate's Degree
In terms of associate's degree, the demographic groups most similar to Shoshone are Immigrants from El Salvador (38.4%, a difference of 0.040%), Immigrants from Honduras (38.5%, a difference of 0.070%), Sioux (38.5%, a difference of 0.13%), Guatemalan (38.5%, a difference of 0.19%), and Colville (38.5%, a difference of 0.27%).
| Demographics | Rating | Rank | Associate's Degree |
| Ute | 0.0 /100 | #299 | Tragic 38.6% |
| Chickasaw | 0.0 /100 | #300 | Tragic 38.6% |
| Tsimshian | 0.0 /100 | #301 | Tragic 38.6% |
| Colville | 0.0 /100 | #302 | Tragic 38.5% |
| Guatemalans | 0.0 /100 | #303 | Tragic 38.5% |
| Sioux | 0.0 /100 | #304 | Tragic 38.5% |
| Immigrants | Honduras | 0.0 /100 | #305 | Tragic 38.5% |
| Shoshone | 0.0 /100 | #306 | Tragic 38.4% |
| Immigrants | El Salvador | 0.0 /100 | #307 | Tragic 38.4% |
| Mexican American Indians | 0.0 /100 | #308 | Tragic 38.2% |
| Immigrants | Guatemala | 0.0 /100 | #309 | Tragic 38.1% |
| Immigrants | Dominican Republic | 0.0 /100 | #310 | Tragic 37.9% |
| Immigrants | Latin America | 0.0 /100 | #311 | Tragic 37.9% |
| Choctaw | 0.0 /100 | #312 | Tragic 37.8% |
| Hispanics or Latinos | 0.0 /100 | #313 | Tragic 37.7% |
Demographics Similar to Immigrants from Poland by Associate's Degree
In terms of associate's degree, the demographic groups most similar to Immigrants from Poland are Immigrants from Germany (47.1%, a difference of 0.050%), Sudanese (47.1%, a difference of 0.090%), South American (47.1%, a difference of 0.12%), Kenyan (47.1%, a difference of 0.13%), and Immigrants from Kenya (47.2%, a difference of 0.26%).
| Demographics | Rating | Rank | Associate's Degree |
| Immigrants | Afghanistan | 74.3 /100 | #152 | Good 47.3% |
| Czechs | 72.2 /100 | #153 | Good 47.2% |
| Immigrants | Kenya | 72.1 /100 | #154 | Good 47.2% |
| Kenyans | 70.6 /100 | #155 | Good 47.1% |
| South Americans | 70.5 /100 | #156 | Good 47.1% |
| Sudanese | 70.3 /100 | #157 | Good 47.1% |
| Immigrants | Germany | 69.7 /100 | #158 | Good 47.1% |
| Immigrants | Poland | 69.2 /100 | #159 | Good 47.1% |
| Scottish | 65.4 /100 | #160 | Good 46.9% |
| Scandinavians | 65.2 /100 | #161 | Good 46.9% |
| Immigrants | Africa | 63.2 /100 | #162 | Good 46.8% |
| Somalis | 62.5 /100 | #163 | Good 46.8% |
| Colombians | 62.4 /100 | #164 | Good 46.8% |
| Immigrants | South America | 59.9 /100 | #165 | Average 46.7% |
| Hungarians | 59.3 /100 | #166 | Average 46.7% |