Peruvian vs Immigrants from Albania GED/Equivalency
COMPARE
Peruvian
Immigrants from Albania
GED/Equivalency
GED/Equivalency Comparison
Peruvians
Immigrants from Albania
84.7%
GED/EQUIVALENCY
9.2/ 100
METRIC RATING
215th/ 347
METRIC RANK
86.0%
GED/EQUIVALENCY
64.2/ 100
METRIC RATING
166th/ 347
METRIC RANK
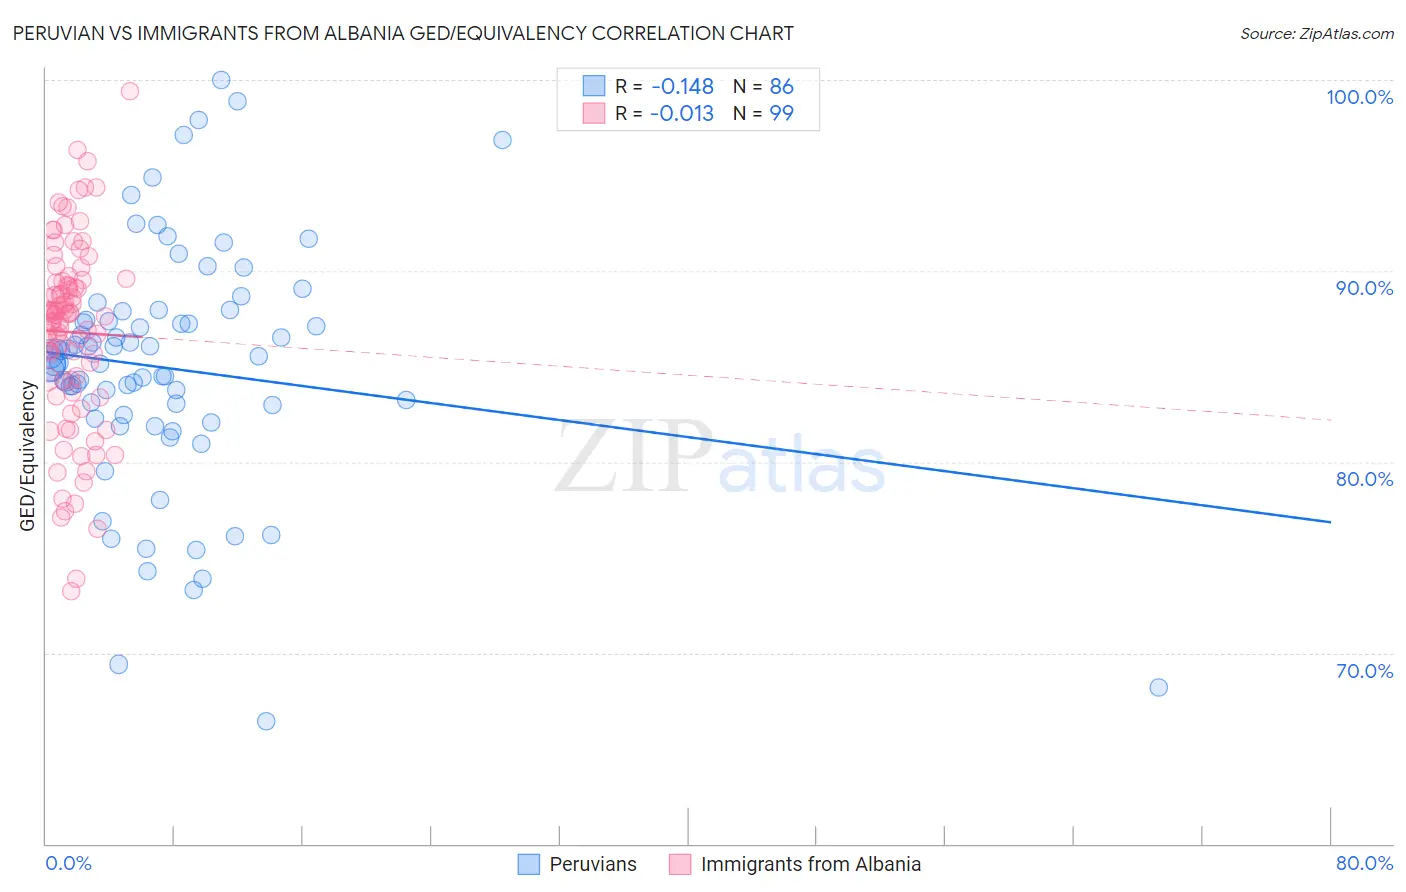
Peruvian vs Immigrants from Albania GED/Equivalency Correlation Chart
The statistical analysis conducted on geographies consisting of 363,251,075 people shows a poor negative correlation between the proportion of Peruvians and percentage of population with at least ged/equivalency education in the United States with a correlation coefficient (R) of -0.148 and weighted average of 84.7%. Similarly, the statistical analysis conducted on geographies consisting of 119,401,336 people shows no correlation between the proportion of Immigrants from Albania and percentage of population with at least ged/equivalency education in the United States with a correlation coefficient (R) of -0.013 and weighted average of 86.0%, a difference of 1.5%.
GED/Equivalency Correlation Summary
| Measurement | Peruvian | Immigrants from Albania |
| Minimum | 66.4% | 73.2% |
| Maximum | 100.0% | 99.4% |
| Range | 33.6% | 26.2% |
| Mean | 84.9% | 86.8% |
| Median | 85.2% | 87.8% |
| Interquartile 25% (IQ1) | 82.5% | 84.3% |
| Interquartile 75% (IQ3) | 87.5% | 89.5% |
| Interquartile Range (IQR) | 5.0% | 5.2% |
| Standard Deviation (Sample) | 6.4% | 4.9% |
| Standard Deviation (Population) | 6.3% | 4.9% |
Similar Demographics by GED/Equivalency
Demographics Similar to Peruvians by GED/Equivalency
In terms of ged/equivalency, the demographic groups most similar to Peruvians are Osage (84.8%, a difference of 0.020%), Immigrants from Micronesia (84.7%, a difference of 0.030%), Nigerian (84.7%, a difference of 0.030%), Alaska Native (84.7%, a difference of 0.030%), and Immigrants from Philippines (84.8%, a difference of 0.050%).
| Demographics | Rating | Rank | GED/Equivalency |
| Marshallese | 12.5 /100 | #208 | Poor 84.9% |
| Colombians | 12.3 /100 | #209 | Poor 84.9% |
| Immigrants | Cameroon | 12.1 /100 | #210 | Poor 84.9% |
| South Americans | 10.9 /100 | #211 | Poor 84.8% |
| Immigrants | Somalia | 10.6 /100 | #212 | Poor 84.8% |
| Immigrants | Philippines | 10.0 /100 | #213 | Poor 84.8% |
| Osage | 9.5 /100 | #214 | Tragic 84.8% |
| Peruvians | 9.2 /100 | #215 | Tragic 84.7% |
| Immigrants | Micronesia | 8.7 /100 | #216 | Tragic 84.7% |
| Nigerians | 8.6 /100 | #217 | Tragic 84.7% |
| Alaska Natives | 8.6 /100 | #218 | Tragic 84.7% |
| Potawatomi | 8.2 /100 | #219 | Tragic 84.7% |
| Americans | 8.2 /100 | #220 | Tragic 84.7% |
| Taiwanese | 8.1 /100 | #221 | Tragic 84.7% |
| Iroquois | 7.5 /100 | #222 | Tragic 84.6% |
Demographics Similar to Immigrants from Albania by GED/Equivalency
In terms of ged/equivalency, the demographic groups most similar to Immigrants from Albania are Alsatian (86.0%, a difference of 0.0%), Ethiopian (86.0%, a difference of 0.010%), Venezuelan (86.0%, a difference of 0.030%), Ugandan (86.1%, a difference of 0.050%), and Sierra Leonean (86.0%, a difference of 0.050%).
| Demographics | Rating | Rank | GED/Equivalency |
| Immigrants | Kenya | 71.8 /100 | #159 | Good 86.2% |
| Immigrants | Morocco | 69.5 /100 | #160 | Good 86.1% |
| Immigrants | Syria | 69.3 /100 | #161 | Good 86.1% |
| Immigrants | Iraq | 68.1 /100 | #162 | Good 86.1% |
| Ugandans | 66.3 /100 | #163 | Good 86.1% |
| Venezuelans | 65.5 /100 | #164 | Good 86.0% |
| Alsatians | 64.3 /100 | #165 | Good 86.0% |
| Immigrants | Albania | 64.2 /100 | #166 | Good 86.0% |
| Ethiopians | 63.7 /100 | #167 | Good 86.0% |
| Sierra Leoneans | 61.8 /100 | #168 | Good 86.0% |
| Immigrants | Ethiopia | 61.2 /100 | #169 | Good 86.0% |
| Afghans | 59.7 /100 | #170 | Average 85.9% |
| Immigrants | Chile | 57.3 /100 | #171 | Average 85.9% |
| Bermudans | 55.1 /100 | #172 | Average 85.8% |
| Immigrants | Venezuela | 50.7 /100 | #173 | Average 85.8% |