Paraguayan vs Immigrants from Congo Associate's Degree
COMPARE
Paraguayan
Immigrants from Congo
Associate's Degree
Associate's Degree Comparison
Paraguayans
Immigrants from Congo
51.8%
ASSOCIATE'S DEGREE
99.8/ 100
METRIC RATING
57th/ 347
METRIC RANK
41.8%
ASSOCIATE'S DEGREE
0.5/ 100
METRIC RATING
256th/ 347
METRIC RANK
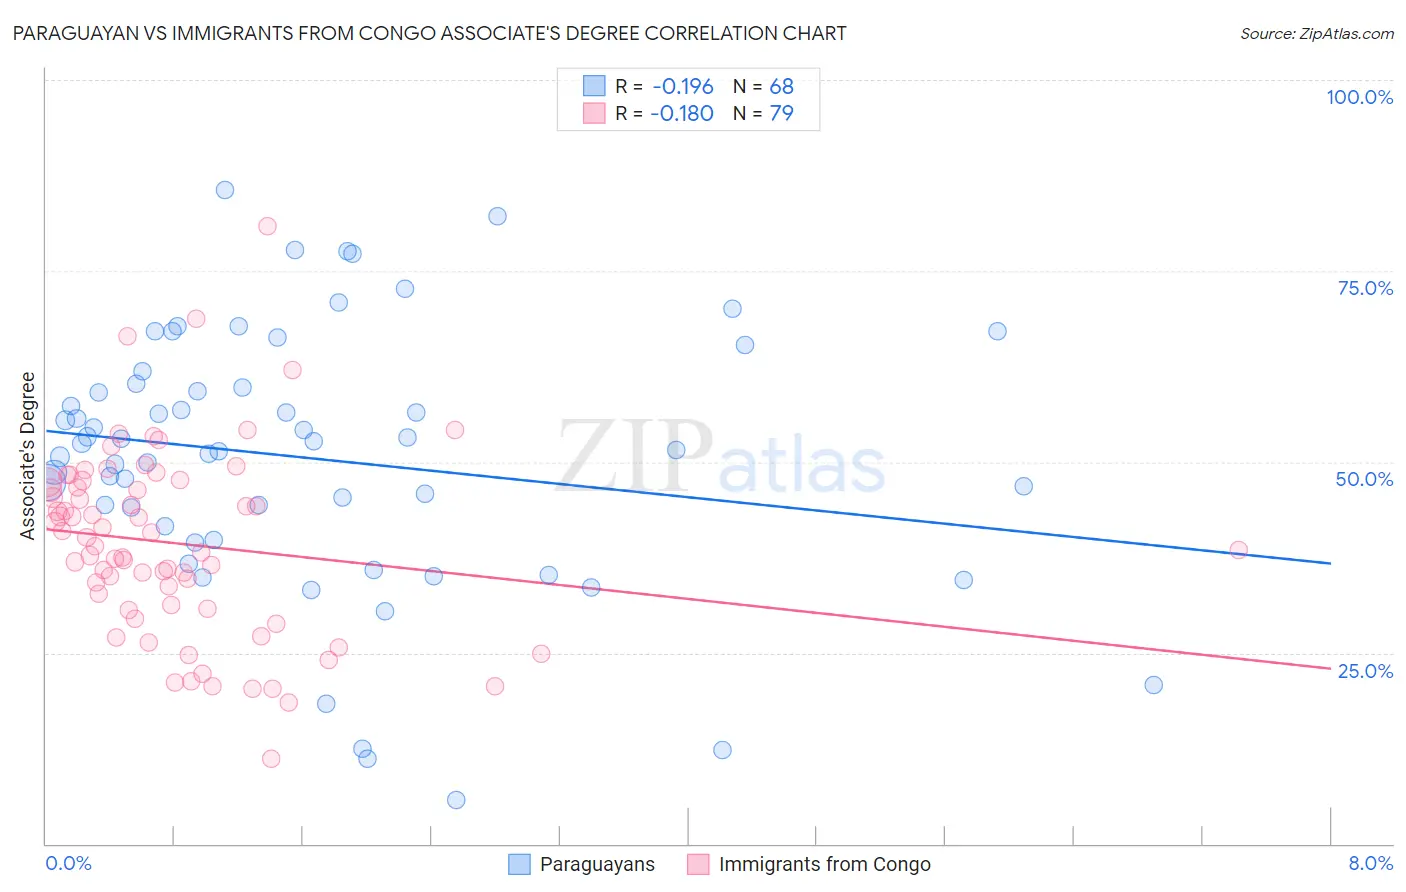
Paraguayan vs Immigrants from Congo Associate's Degree Correlation Chart
The statistical analysis conducted on geographies consisting of 95,113,072 people shows a poor negative correlation between the proportion of Paraguayans and percentage of population with at least associate's degree education in the United States with a correlation coefficient (R) of -0.196 and weighted average of 51.8%. Similarly, the statistical analysis conducted on geographies consisting of 92,128,730 people shows a poor negative correlation between the proportion of Immigrants from Congo and percentage of population with at least associate's degree education in the United States with a correlation coefficient (R) of -0.180 and weighted average of 41.8%, a difference of 24.0%.
Associate's Degree Correlation Summary
| Measurement | Paraguayan | Immigrants from Congo |
| Minimum | 5.7% | 11.1% |
| Maximum | 85.7% | 80.9% |
| Range | 79.9% | 69.7% |
| Mean | 50.4% | 39.3% |
| Median | 52.0% | 39.0% |
| Interquartile 25% (IQ1) | 40.7% | 30.7% |
| Interquartile 75% (IQ3) | 60.0% | 47.3% |
| Interquartile Range (IQR) | 19.3% | 16.6% |
| Standard Deviation (Sample) | 17.1% | 12.3% |
| Standard Deviation (Population) | 17.0% | 12.2% |
Similar Demographics by Associate's Degree
Demographics Similar to Paraguayans by Associate's Degree
In terms of associate's degree, the demographic groups most similar to Paraguayans are New Zealander (51.8%, a difference of 0.030%), Immigrants from Czechoslovakia (51.9%, a difference of 0.12%), Australian (51.9%, a difference of 0.14%), Immigrants from Serbia (51.7%, a difference of 0.16%), and Immigrants from Spain (51.9%, a difference of 0.17%).
| Demographics | Rating | Rank | Associate's Degree |
| Asians | 99.9 /100 | #50 | Exceptional 52.1% |
| Immigrants | Greece | 99.9 /100 | #51 | Exceptional 52.1% |
| Bolivians | 99.8 /100 | #52 | Exceptional 52.0% |
| Immigrants | Asia | 99.8 /100 | #53 | Exceptional 52.0% |
| Immigrants | Spain | 99.8 /100 | #54 | Exceptional 51.9% |
| Australians | 99.8 /100 | #55 | Exceptional 51.9% |
| Immigrants | Czechoslovakia | 99.8 /100 | #56 | Exceptional 51.9% |
| Paraguayans | 99.8 /100 | #57 | Exceptional 51.8% |
| New Zealanders | 99.8 /100 | #58 | Exceptional 51.8% |
| Immigrants | Serbia | 99.8 /100 | #59 | Exceptional 51.7% |
| Immigrants | Bolivia | 99.7 /100 | #60 | Exceptional 51.5% |
| Immigrants | Kazakhstan | 99.7 /100 | #61 | Exceptional 51.4% |
| Bhutanese | 99.7 /100 | #62 | Exceptional 51.4% |
| South Africans | 99.7 /100 | #63 | Exceptional 51.4% |
| Immigrants | Netherlands | 99.7 /100 | #64 | Exceptional 51.4% |
Demographics Similar to Immigrants from Congo by Associate's Degree
In terms of associate's degree, the demographic groups most similar to Immigrants from Congo are Spanish American (41.8%, a difference of 0.060%), Immigrants from Guyana (41.8%, a difference of 0.12%), Cuban (41.9%, a difference of 0.21%), Japanese (41.7%, a difference of 0.27%), and Indonesian (41.9%, a difference of 0.28%).
| Demographics | Rating | Rank | Associate's Degree |
| Jamaicans | 0.7 /100 | #249 | Tragic 42.1% |
| U.S. Virgin Islanders | 0.7 /100 | #250 | Tragic 42.1% |
| Immigrants | Bahamas | 0.7 /100 | #251 | Tragic 42.1% |
| French American Indians | 0.6 /100 | #252 | Tragic 42.0% |
| Indonesians | 0.6 /100 | #253 | Tragic 41.9% |
| Cubans | 0.6 /100 | #254 | Tragic 41.9% |
| Immigrants | Guyana | 0.5 /100 | #255 | Tragic 41.8% |
| Immigrants | Congo | 0.5 /100 | #256 | Tragic 41.8% |
| Spanish Americans | 0.5 /100 | #257 | Tragic 41.8% |
| Japanese | 0.5 /100 | #258 | Tragic 41.7% |
| Malaysians | 0.4 /100 | #259 | Tragic 41.6% |
| Marshallese | 0.4 /100 | #260 | Tragic 41.6% |
| Nicaraguans | 0.4 /100 | #261 | Tragic 41.5% |
| Bahamians | 0.4 /100 | #262 | Tragic 41.5% |
| Immigrants | Jamaica | 0.3 /100 | #263 | Tragic 41.5% |