Luxembourger vs Immigrants from Congo GED/Equivalency
COMPARE
Luxembourger
Immigrants from Congo
GED/Equivalency
GED/Equivalency Comparison
Luxembourgers
Immigrants from Congo
88.6%
GED/EQUIVALENCY
99.8/ 100
METRIC RATING
21st/ 347
METRIC RANK
83.1%
GED/EQUIVALENCY
0.2/ 100
METRIC RATING
263rd/ 347
METRIC RANK
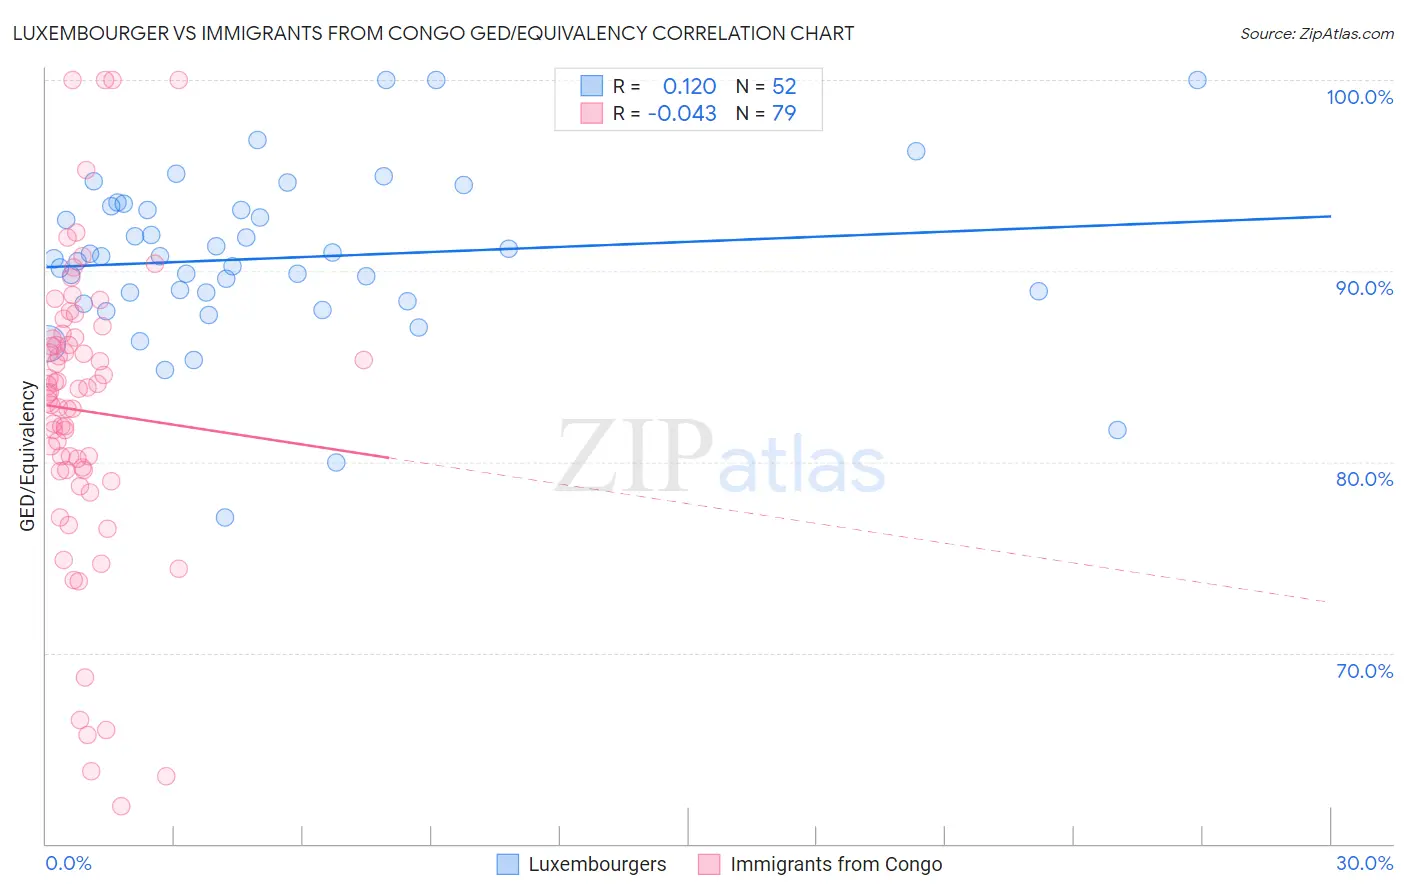
Luxembourger vs Immigrants from Congo GED/Equivalency Correlation Chart
The statistical analysis conducted on geographies consisting of 144,675,955 people shows a poor positive correlation between the proportion of Luxembourgers and percentage of population with at least ged/equivalency education in the United States with a correlation coefficient (R) of 0.120 and weighted average of 88.6%. Similarly, the statistical analysis conducted on geographies consisting of 92,095,910 people shows no correlation between the proportion of Immigrants from Congo and percentage of population with at least ged/equivalency education in the United States with a correlation coefficient (R) of -0.043 and weighted average of 83.1%, a difference of 6.7%.
GED/Equivalency Correlation Summary
| Measurement | Luxembourger | Immigrants from Congo |
| Minimum | 77.1% | 62.0% |
| Maximum | 100.0% | 100.0% |
| Range | 22.9% | 38.0% |
| Mean | 90.7% | 82.7% |
| Median | 90.7% | 83.7% |
| Interquartile 25% (IQ1) | 88.7% | 79.5% |
| Interquartile 75% (IQ3) | 93.3% | 86.5% |
| Interquartile Range (IQR) | 4.6% | 7.0% |
| Standard Deviation (Sample) | 4.5% | 7.9% |
| Standard Deviation (Population) | 4.4% | 7.8% |
Similar Demographics by GED/Equivalency
Demographics Similar to Luxembourgers by GED/Equivalency
In terms of ged/equivalency, the demographic groups most similar to Luxembourgers are Maltese (88.6%, a difference of 0.010%), Immigrants from Ireland (88.6%, a difference of 0.010%), Russian (88.6%, a difference of 0.030%), Slovak (88.6%, a difference of 0.030%), and Estonian (88.6%, a difference of 0.030%).
| Demographics | Rating | Rank | GED/Equivalency |
| Cypriots | 99.9 /100 | #14 | Exceptional 88.9% |
| Okinawans | 99.9 /100 | #15 | Exceptional 88.9% |
| Immigrants | Taiwan | 99.9 /100 | #16 | Exceptional 88.8% |
| Croatians | 99.9 /100 | #17 | Exceptional 88.8% |
| Slovenes | 99.9 /100 | #18 | Exceptional 88.8% |
| Swedes | 99.9 /100 | #19 | Exceptional 88.8% |
| Maltese | 99.9 /100 | #20 | Exceptional 88.6% |
| Luxembourgers | 99.8 /100 | #21 | Exceptional 88.6% |
| Immigrants | Ireland | 99.8 /100 | #22 | Exceptional 88.6% |
| Russians | 99.8 /100 | #23 | Exceptional 88.6% |
| Slovaks | 99.8 /100 | #24 | Exceptional 88.6% |
| Estonians | 99.8 /100 | #25 | Exceptional 88.6% |
| Immigrants | Australia | 99.8 /100 | #26 | Exceptional 88.6% |
| Immigrants | Lithuania | 99.8 /100 | #27 | Exceptional 88.6% |
| Immigrants | Northern Europe | 99.8 /100 | #28 | Exceptional 88.5% |
Demographics Similar to Immigrants from Congo by GED/Equivalency
In terms of ged/equivalency, the demographic groups most similar to Immigrants from Congo are Inupiat (83.1%, a difference of 0.010%), Immigrants from Armenia (83.1%, a difference of 0.010%), Bangladeshi (83.1%, a difference of 0.010%), West Indian (83.1%, a difference of 0.020%), and Kiowa (83.1%, a difference of 0.030%).
| Demographics | Rating | Rank | GED/Equivalency |
| Africans | 0.5 /100 | #256 | Tragic 83.4% |
| Jamaicans | 0.4 /100 | #257 | Tragic 83.3% |
| Malaysians | 0.4 /100 | #258 | Tragic 83.3% |
| Immigrants | Vietnam | 0.3 /100 | #259 | Tragic 83.2% |
| Choctaw | 0.3 /100 | #260 | Tragic 83.1% |
| Inupiat | 0.2 /100 | #261 | Tragic 83.1% |
| Immigrants | Armenia | 0.2 /100 | #262 | Tragic 83.1% |
| Immigrants | Congo | 0.2 /100 | #263 | Tragic 83.1% |
| Bangladeshis | 0.2 /100 | #264 | Tragic 83.1% |
| West Indians | 0.2 /100 | #265 | Tragic 83.1% |
| Kiowa | 0.2 /100 | #266 | Tragic 83.1% |
| Trinidadians and Tobagonians | 0.2 /100 | #267 | Tragic 83.0% |
| Immigrants | Burma/Myanmar | 0.2 /100 | #268 | Tragic 83.0% |
| Hopi | 0.2 /100 | #269 | Tragic 83.0% |
| Immigrants | Jamaica | 0.2 /100 | #270 | Tragic 82.9% |