Immigrants from West Indies vs Immigrants from Congo GED/Equivalency
COMPARE
Immigrants from West Indies
Immigrants from Congo
GED/Equivalency
GED/Equivalency Comparison
Immigrants from West Indies
Immigrants from Congo
82.4%
GED/EQUIVALENCY
0.0/ 100
METRIC RATING
286th/ 347
METRIC RANK
83.1%
GED/EQUIVALENCY
0.2/ 100
METRIC RATING
263rd/ 347
METRIC RANK
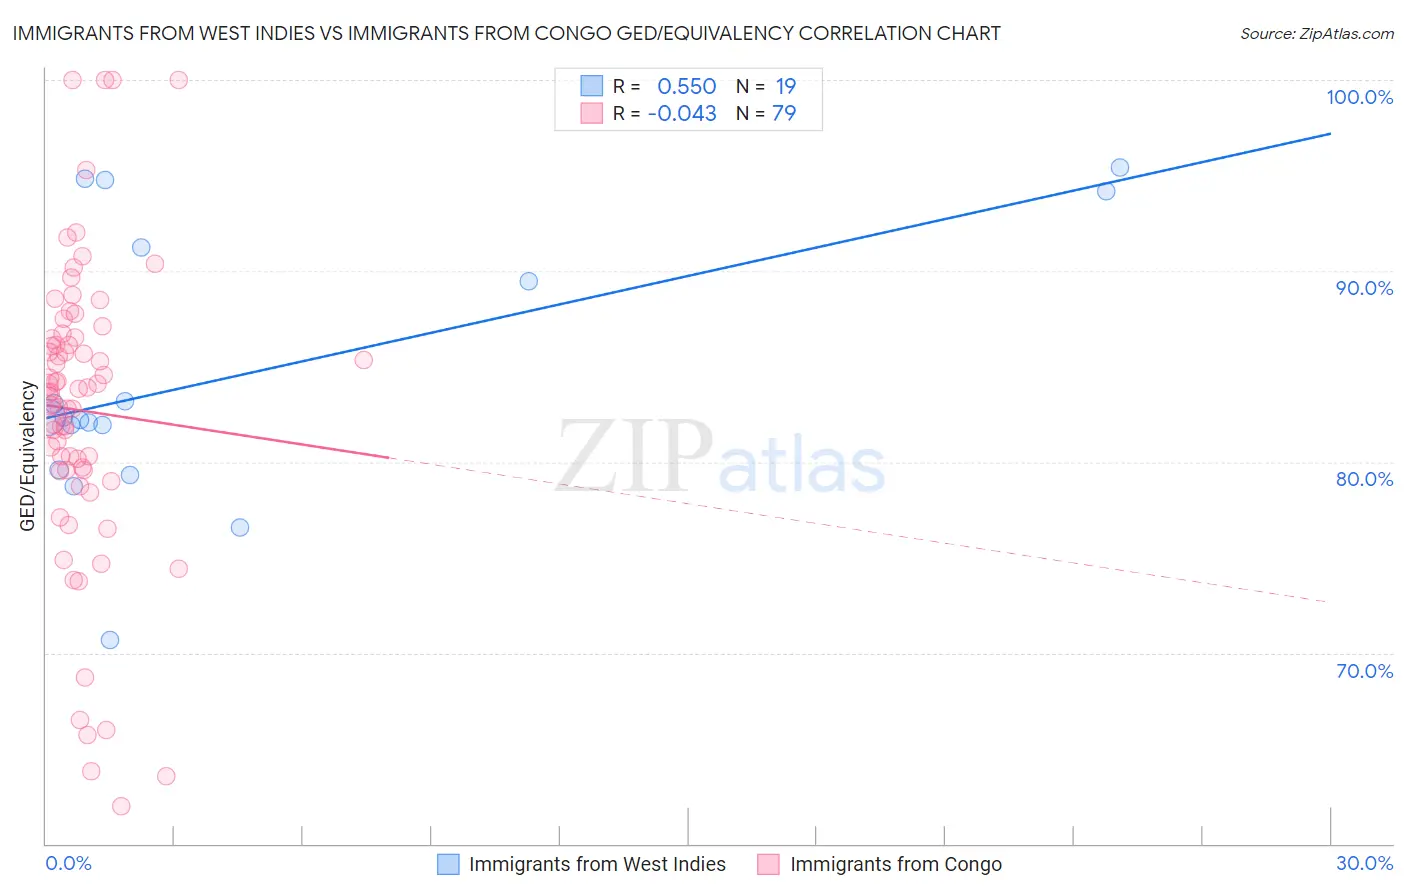
Immigrants from West Indies vs Immigrants from Congo GED/Equivalency Correlation Chart
The statistical analysis conducted on geographies consisting of 72,457,514 people shows a substantial positive correlation between the proportion of Immigrants from West Indies and percentage of population with at least ged/equivalency education in the United States with a correlation coefficient (R) of 0.550 and weighted average of 82.4%. Similarly, the statistical analysis conducted on geographies consisting of 92,095,910 people shows no correlation between the proportion of Immigrants from Congo and percentage of population with at least ged/equivalency education in the United States with a correlation coefficient (R) of -0.043 and weighted average of 83.1%, a difference of 0.84%.
GED/Equivalency Correlation Summary
| Measurement | Immigrants from West Indies | Immigrants from Congo |
| Minimum | 70.7% | 62.0% |
| Maximum | 95.4% | 100.0% |
| Range | 24.7% | 38.0% |
| Mean | 84.4% | 82.7% |
| Median | 82.3% | 83.7% |
| Interquartile 25% (IQ1) | 79.6% | 79.5% |
| Interquartile 75% (IQ3) | 91.2% | 86.5% |
| Interquartile Range (IQR) | 11.7% | 7.0% |
| Standard Deviation (Sample) | 7.0% | 7.9% |
| Standard Deviation (Population) | 6.8% | 7.8% |
Similar Demographics by GED/Equivalency
Demographics Similar to Immigrants from West Indies by GED/Equivalency
In terms of ged/equivalency, the demographic groups most similar to Immigrants from West Indies are Cajun (82.4%, a difference of 0.020%), Japanese (82.4%, a difference of 0.020%), Immigrants from Barbados (82.4%, a difference of 0.060%), Pueblo (82.3%, a difference of 0.12%), and Indonesian (82.5%, a difference of 0.18%).
| Demographics | Rating | Rank | GED/Equivalency |
| Immigrants | Fiji | 0.1 /100 | #279 | Tragic 82.7% |
| Cheyenne | 0.1 /100 | #280 | Tragic 82.7% |
| Sioux | 0.1 /100 | #281 | Tragic 82.6% |
| Immigrants | Immigrants | 0.1 /100 | #282 | Tragic 82.6% |
| Indonesians | 0.1 /100 | #283 | Tragic 82.5% |
| Immigrants | Barbados | 0.1 /100 | #284 | Tragic 82.4% |
| Cajuns | 0.0 /100 | #285 | Tragic 82.4% |
| Immigrants | West Indies | 0.0 /100 | #286 | Tragic 82.4% |
| Japanese | 0.0 /100 | #287 | Tragic 82.4% |
| Pueblo | 0.0 /100 | #288 | Tragic 82.3% |
| Immigrants | Cambodia | 0.0 /100 | #289 | Tragic 82.2% |
| Haitians | 0.0 /100 | #290 | Tragic 82.1% |
| Cubans | 0.0 /100 | #291 | Tragic 82.0% |
| Paiute | 0.0 /100 | #292 | Tragic 82.0% |
| British West Indians | 0.0 /100 | #293 | Tragic 82.0% |
Demographics Similar to Immigrants from Congo by GED/Equivalency
In terms of ged/equivalency, the demographic groups most similar to Immigrants from Congo are Inupiat (83.1%, a difference of 0.010%), Immigrants from Armenia (83.1%, a difference of 0.010%), Bangladeshi (83.1%, a difference of 0.010%), West Indian (83.1%, a difference of 0.020%), and Kiowa (83.1%, a difference of 0.030%).
| Demographics | Rating | Rank | GED/Equivalency |
| Africans | 0.5 /100 | #256 | Tragic 83.4% |
| Jamaicans | 0.4 /100 | #257 | Tragic 83.3% |
| Malaysians | 0.4 /100 | #258 | Tragic 83.3% |
| Immigrants | Vietnam | 0.3 /100 | #259 | Tragic 83.2% |
| Choctaw | 0.3 /100 | #260 | Tragic 83.1% |
| Inupiat | 0.2 /100 | #261 | Tragic 83.1% |
| Immigrants | Armenia | 0.2 /100 | #262 | Tragic 83.1% |
| Immigrants | Congo | 0.2 /100 | #263 | Tragic 83.1% |
| Bangladeshis | 0.2 /100 | #264 | Tragic 83.1% |
| West Indians | 0.2 /100 | #265 | Tragic 83.1% |
| Kiowa | 0.2 /100 | #266 | Tragic 83.1% |
| Trinidadians and Tobagonians | 0.2 /100 | #267 | Tragic 83.0% |
| Immigrants | Burma/Myanmar | 0.2 /100 | #268 | Tragic 83.0% |
| Hopi | 0.2 /100 | #269 | Tragic 83.0% |
| Immigrants | Jamaica | 0.2 /100 | #270 | Tragic 82.9% |