Canadian vs Immigrants from Congo GED/Equivalency
COMPARE
Canadian
Immigrants from Congo
GED/Equivalency
GED/Equivalency Comparison
Canadians
Immigrants from Congo
87.1%
GED/EQUIVALENCY
95.6/ 100
METRIC RATING
108th/ 347
METRIC RANK
83.1%
GED/EQUIVALENCY
0.2/ 100
METRIC RATING
263rd/ 347
METRIC RANK
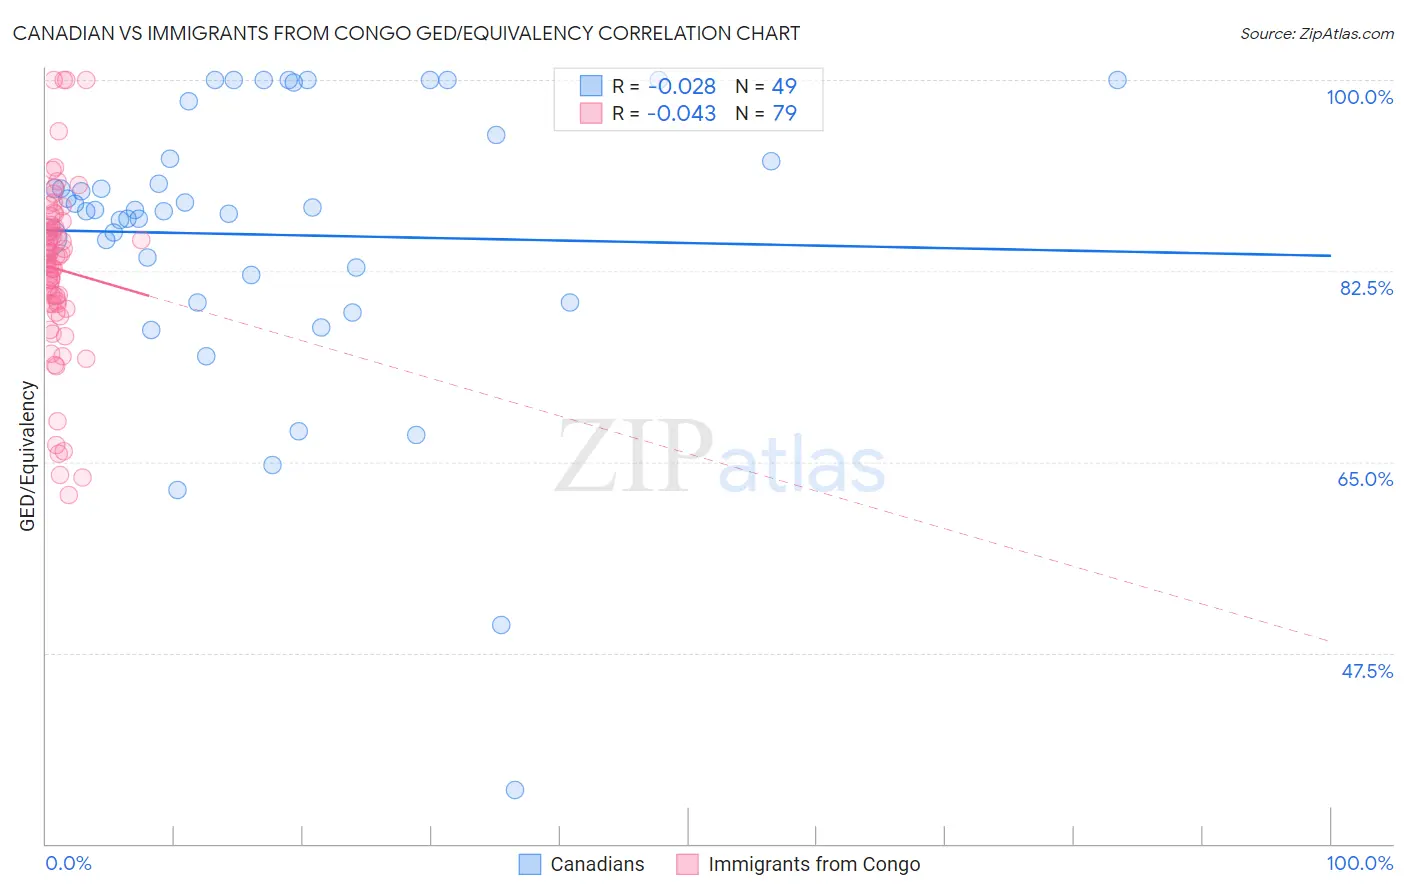
Canadian vs Immigrants from Congo GED/Equivalency Correlation Chart
The statistical analysis conducted on geographies consisting of 437,556,595 people shows no correlation between the proportion of Canadians and percentage of population with at least ged/equivalency education in the United States with a correlation coefficient (R) of -0.028 and weighted average of 87.1%. Similarly, the statistical analysis conducted on geographies consisting of 92,095,910 people shows no correlation between the proportion of Immigrants from Congo and percentage of population with at least ged/equivalency education in the United States with a correlation coefficient (R) of -0.043 and weighted average of 83.1%, a difference of 4.9%.
GED/Equivalency Correlation Summary
| Measurement | Canadian | Immigrants from Congo |
| Minimum | 34.9% | 62.0% |
| Maximum | 100.0% | 100.0% |
| Range | 65.1% | 38.0% |
| Mean | 85.8% | 82.7% |
| Median | 88.1% | 83.7% |
| Interquartile 25% (IQ1) | 80.9% | 79.5% |
| Interquartile 75% (IQ3) | 93.9% | 86.5% |
| Interquartile Range (IQR) | 13.0% | 7.0% |
| Standard Deviation (Sample) | 13.3% | 7.9% |
| Standard Deviation (Population) | 13.1% | 7.8% |
Similar Demographics by GED/Equivalency
Demographics Similar to Canadians by GED/Equivalency
In terms of ged/equivalency, the demographic groups most similar to Canadians are Immigrants from Eastern Europe (87.1%, a difference of 0.010%), Icelander (87.1%, a difference of 0.020%), Immigrants from Zimbabwe (87.1%, a difference of 0.030%), Indian (Asian) (87.1%, a difference of 0.040%), and Egyptian (87.1%, a difference of 0.040%).
| Demographics | Rating | Rank | GED/Equivalency |
| Syrians | 96.6 /100 | #101 | Exceptional 87.2% |
| Lebanese | 96.2 /100 | #102 | Exceptional 87.2% |
| Jordanians | 96.1 /100 | #103 | Exceptional 87.2% |
| Immigrants | Hungary | 96.0 /100 | #104 | Exceptional 87.2% |
| Indians (Asian) | 95.9 /100 | #105 | Exceptional 87.1% |
| Immigrants | Zimbabwe | 95.8 /100 | #106 | Exceptional 87.1% |
| Icelanders | 95.7 /100 | #107 | Exceptional 87.1% |
| Canadians | 95.6 /100 | #108 | Exceptional 87.1% |
| Immigrants | Eastern Europe | 95.5 /100 | #109 | Exceptional 87.1% |
| Egyptians | 95.3 /100 | #110 | Exceptional 87.1% |
| French | 95.2 /100 | #111 | Exceptional 87.1% |
| Tlingit-Haida | 94.8 /100 | #112 | Exceptional 87.0% |
| Assyrians/Chaldeans/Syriacs | 94.8 /100 | #113 | Exceptional 87.0% |
| Immigrants | Kazakhstan | 94.7 /100 | #114 | Exceptional 87.0% |
| Mongolians | 94.6 /100 | #115 | Exceptional 87.0% |
Demographics Similar to Immigrants from Congo by GED/Equivalency
In terms of ged/equivalency, the demographic groups most similar to Immigrants from Congo are Inupiat (83.1%, a difference of 0.010%), Immigrants from Armenia (83.1%, a difference of 0.010%), Bangladeshi (83.1%, a difference of 0.010%), West Indian (83.1%, a difference of 0.020%), and Kiowa (83.1%, a difference of 0.030%).
| Demographics | Rating | Rank | GED/Equivalency |
| Africans | 0.5 /100 | #256 | Tragic 83.4% |
| Jamaicans | 0.4 /100 | #257 | Tragic 83.3% |
| Malaysians | 0.4 /100 | #258 | Tragic 83.3% |
| Immigrants | Vietnam | 0.3 /100 | #259 | Tragic 83.2% |
| Choctaw | 0.3 /100 | #260 | Tragic 83.1% |
| Inupiat | 0.2 /100 | #261 | Tragic 83.1% |
| Immigrants | Armenia | 0.2 /100 | #262 | Tragic 83.1% |
| Immigrants | Congo | 0.2 /100 | #263 | Tragic 83.1% |
| Bangladeshis | 0.2 /100 | #264 | Tragic 83.1% |
| West Indians | 0.2 /100 | #265 | Tragic 83.1% |
| Kiowa | 0.2 /100 | #266 | Tragic 83.1% |
| Trinidadians and Tobagonians | 0.2 /100 | #267 | Tragic 83.0% |
| Immigrants | Burma/Myanmar | 0.2 /100 | #268 | Tragic 83.0% |
| Hopi | 0.2 /100 | #269 | Tragic 83.0% |
| Immigrants | Jamaica | 0.2 /100 | #270 | Tragic 82.9% |