Paraguayan vs Immigrants from Congo 8th Grade
COMPARE
Paraguayan
Immigrants from Congo
8th Grade
8th Grade Comparison
Paraguayans
Immigrants from Congo
95.5%
8TH GRADE
22.6/ 100
METRIC RATING
198th/ 347
METRIC RANK
94.9%
8TH GRADE
0.6/ 100
METRIC RATING
258th/ 347
METRIC RANK
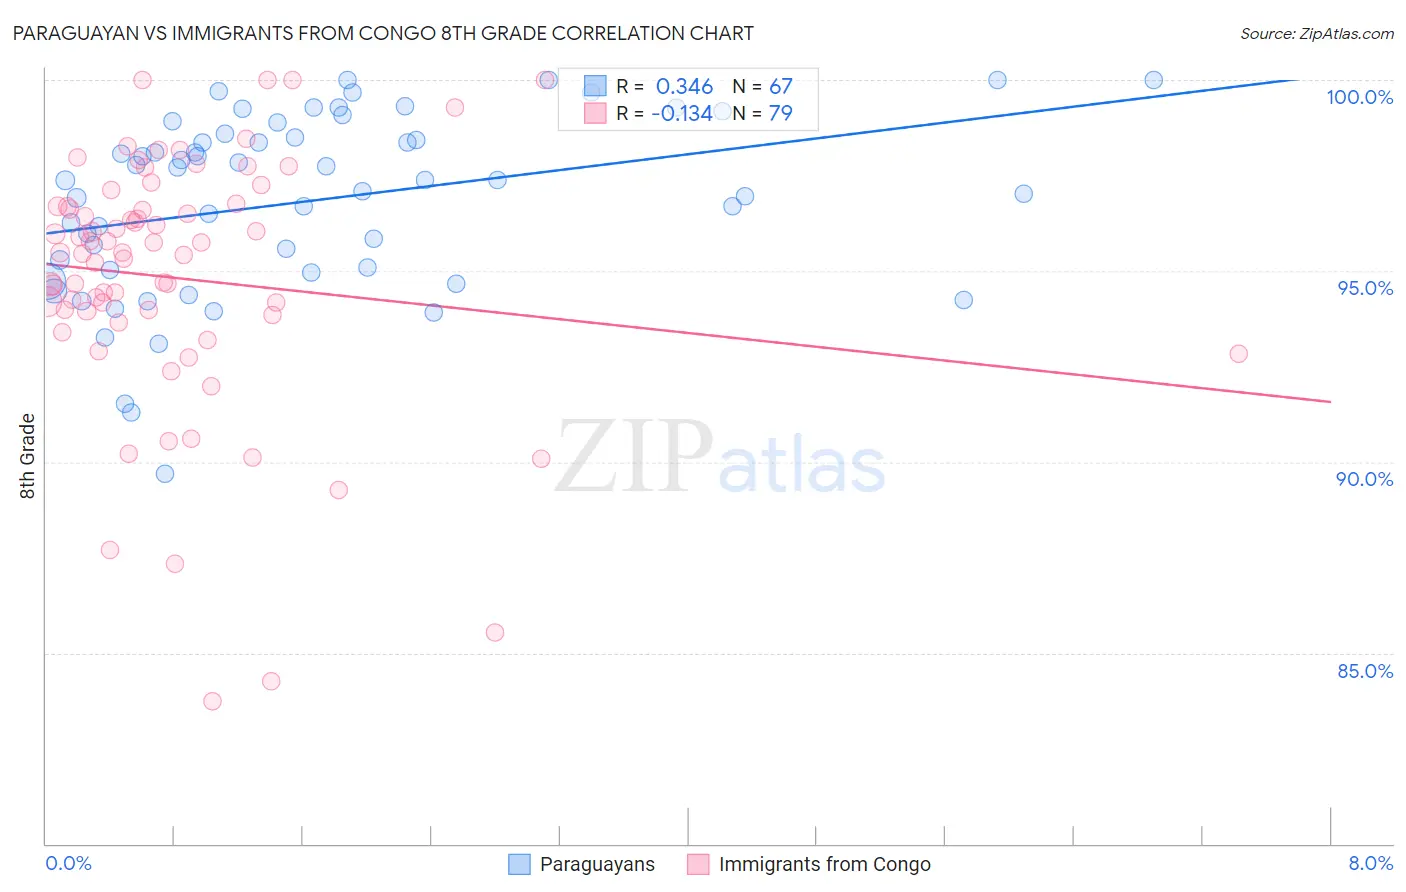
Paraguayan vs Immigrants from Congo 8th Grade Correlation Chart
The statistical analysis conducted on geographies consisting of 95,113,577 people shows a mild positive correlation between the proportion of Paraguayans and percentage of population with at least 8th grade education in the United States with a correlation coefficient (R) of 0.346 and weighted average of 95.5%. Similarly, the statistical analysis conducted on geographies consisting of 92,121,907 people shows a poor negative correlation between the proportion of Immigrants from Congo and percentage of population with at least 8th grade education in the United States with a correlation coefficient (R) of -0.134 and weighted average of 94.9%, a difference of 0.63%.
8th Grade Correlation Summary
| Measurement | Paraguayan | Immigrants from Congo |
| Minimum | 89.7% | 83.7% |
| Maximum | 100.0% | 100.0% |
| Range | 10.3% | 16.3% |
| Mean | 96.8% | 94.8% |
| Median | 97.4% | 95.5% |
| Interquartile 25% (IQ1) | 95.0% | 93.8% |
| Interquartile 75% (IQ3) | 98.6% | 96.7% |
| Interquartile Range (IQR) | 3.6% | 2.9% |
| Standard Deviation (Sample) | 2.3% | 3.4% |
| Standard Deviation (Population) | 2.3% | 3.4% |
Similar Demographics by 8th Grade
Demographics Similar to Paraguayans by 8th Grade
In terms of 8th grade, the demographic groups most similar to Paraguayans are Immigrants from Northern Africa (95.5%, a difference of 0.0%), Argentinean (95.5%, a difference of 0.0%), Immigrants from Zaire (95.6%, a difference of 0.020%), Assyrian/Chaldean/Syriac (95.6%, a difference of 0.020%), and Sierra Leonean (95.6%, a difference of 0.020%).
| Demographics | Rating | Rank | 8th Grade |
| Immigrants | Nepal | 30.2 /100 | #191 | Fair 95.6% |
| Pima | 28.6 /100 | #192 | Fair 95.6% |
| Panamanians | 28.4 /100 | #193 | Fair 95.6% |
| Guamanians/Chamorros | 26.6 /100 | #194 | Fair 95.6% |
| Immigrants | Zaire | 25.2 /100 | #195 | Fair 95.6% |
| Assyrians/Chaldeans/Syriacs | 24.5 /100 | #196 | Fair 95.6% |
| Sierra Leoneans | 24.3 /100 | #197 | Fair 95.6% |
| Paraguayans | 22.6 /100 | #198 | Fair 95.5% |
| Immigrants | Northern Africa | 22.5 /100 | #199 | Fair 95.5% |
| Argentineans | 22.2 /100 | #200 | Fair 95.5% |
| Immigrants | Argentina | 20.6 /100 | #201 | Fair 95.5% |
| Apache | 19.4 /100 | #202 | Poor 95.5% |
| Moroccans | 17.4 /100 | #203 | Poor 95.5% |
| Hawaiians | 16.7 /100 | #204 | Poor 95.5% |
| Immigrants | Bahamas | 16.7 /100 | #205 | Poor 95.5% |
Demographics Similar to Immigrants from Congo by 8th Grade
In terms of 8th grade, the demographic groups most similar to Immigrants from Congo are Ghanaian (94.9%, a difference of 0.0%), Afghan (94.9%, a difference of 0.010%), Immigrants from Jamaica (94.9%, a difference of 0.010%), Colombian (95.0%, a difference of 0.020%), and Immigrants from Somalia (95.0%, a difference of 0.030%).
| Demographics | Rating | Rank | 8th Grade |
| Bolivians | 1.0 /100 | #251 | Tragic 95.0% |
| Immigrants | Ethiopia | 1.0 /100 | #252 | Tragic 95.0% |
| U.S. Virgin Islanders | 0.9 /100 | #253 | Tragic 95.0% |
| Immigrants | Cameroon | 0.8 /100 | #254 | Tragic 95.0% |
| Immigrants | Somalia | 0.7 /100 | #255 | Tragic 95.0% |
| Colombians | 0.7 /100 | #256 | Tragic 95.0% |
| Afghans | 0.6 /100 | #257 | Tragic 94.9% |
| Immigrants | Congo | 0.6 /100 | #258 | Tragic 94.9% |
| Ghanaians | 0.6 /100 | #259 | Tragic 94.9% |
| Immigrants | Jamaica | 0.6 /100 | #260 | Tragic 94.9% |
| Immigrants | Costa Rica | 0.5 /100 | #261 | Tragic 94.9% |
| Immigrants | Nigeria | 0.4 /100 | #262 | Tragic 94.9% |
| Immigrants | Hong Kong | 0.4 /100 | #263 | Tragic 94.9% |
| South Americans | 0.4 /100 | #264 | Tragic 94.9% |
| Yuman | 0.4 /100 | #265 | Tragic 94.9% |