Asian vs French American Indian GED/Equivalency
COMPARE
Asian
French American Indian
GED/Equivalency
GED/Equivalency Comparison
Asians
French American Indians
86.7%
GED/EQUIVALENCY
90.3/ 100
METRIC RATING
126th/ 347
METRIC RANK
84.6%
GED/EQUIVALENCY
6.3/ 100
METRIC RATING
224th/ 347
METRIC RANK
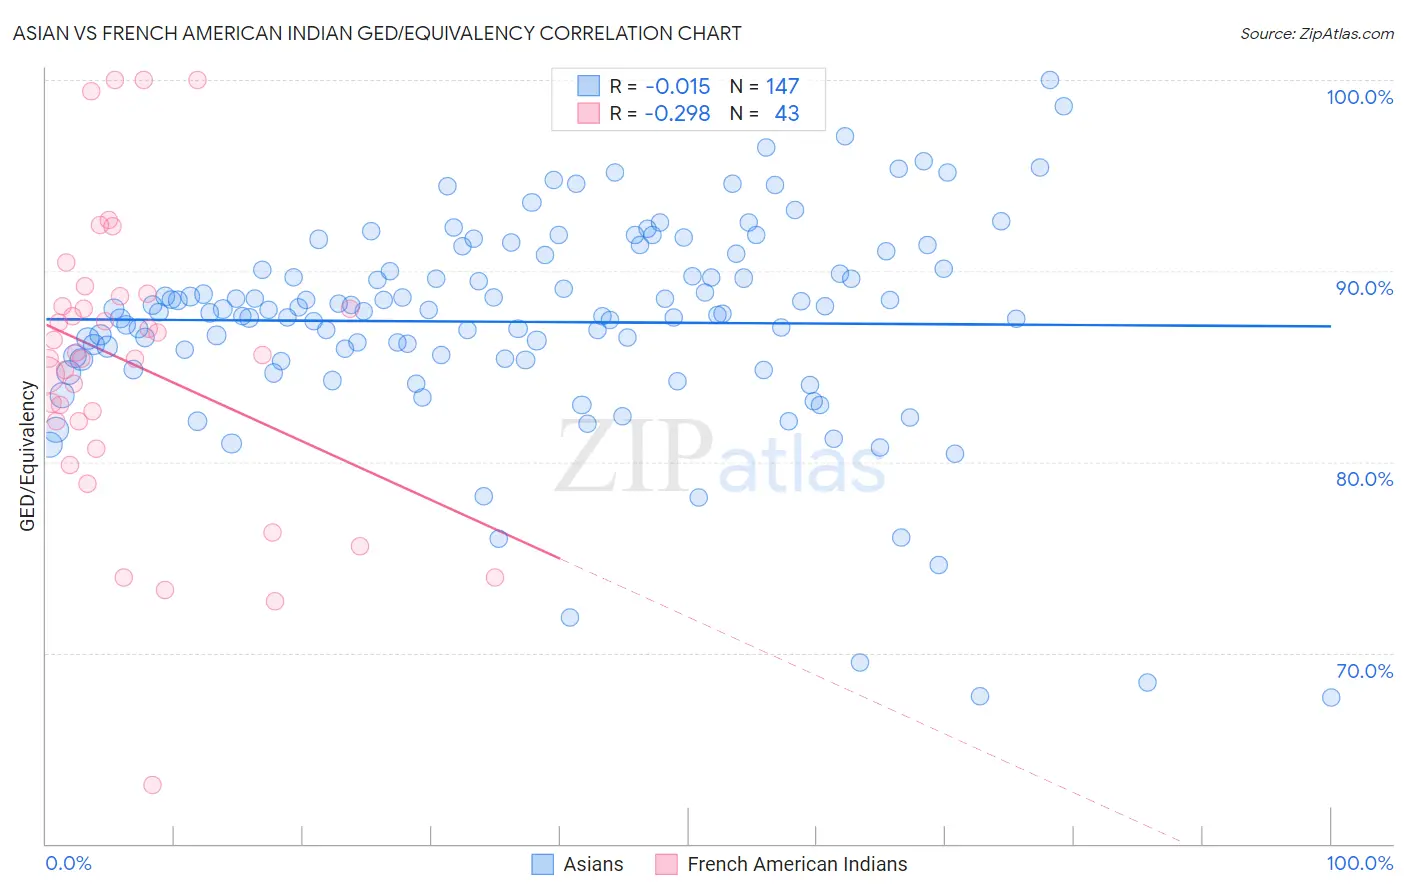
Asian vs French American Indian GED/Equivalency Correlation Chart
The statistical analysis conducted on geographies consisting of 550,857,886 people shows no correlation between the proportion of Asians and percentage of population with at least ged/equivalency education in the United States with a correlation coefficient (R) of -0.015 and weighted average of 86.7%. Similarly, the statistical analysis conducted on geographies consisting of 131,976,269 people shows a weak negative correlation between the proportion of French American Indians and percentage of population with at least ged/equivalency education in the United States with a correlation coefficient (R) of -0.298 and weighted average of 84.6%, a difference of 2.6%.
GED/Equivalency Correlation Summary
| Measurement | Asian | French American Indian |
| Minimum | 67.7% | 63.0% |
| Maximum | 100.0% | 100.0% |
| Range | 32.3% | 37.0% |
| Mean | 87.3% | 85.2% |
| Median | 87.9% | 85.6% |
| Interquartile 25% (IQ1) | 85.4% | 82.1% |
| Interquartile 75% (IQ3) | 90.1% | 88.7% |
| Interquartile Range (IQR) | 4.8% | 6.6% |
| Standard Deviation (Sample) | 5.5% | 7.7% |
| Standard Deviation (Population) | 5.5% | 7.6% |
Similar Demographics by GED/Equivalency
Demographics Similar to Asians by GED/Equivalency
In terms of ged/equivalency, the demographic groups most similar to Asians are Immigrants from Egypt (86.7%, a difference of 0.010%), Celtic (86.7%, a difference of 0.010%), Immigrants from Italy (86.7%, a difference of 0.020%), Immigrants from Jordan (86.8%, a difference of 0.030%), and Argentinean (86.7%, a difference of 0.030%).
| Demographics | Rating | Rank | GED/Equivalency |
| Immigrants | China | 93.2 /100 | #119 | Exceptional 86.9% |
| Scotch-Irish | 91.6 /100 | #120 | Exceptional 86.8% |
| Immigrants | Lebanon | 90.9 /100 | #121 | Exceptional 86.8% |
| Immigrants | Jordan | 90.8 /100 | #122 | Exceptional 86.8% |
| Immigrants | Italy | 90.5 /100 | #123 | Exceptional 86.7% |
| Immigrants | Egypt | 90.4 /100 | #124 | Exceptional 86.7% |
| Celtics | 90.4 /100 | #125 | Exceptional 86.7% |
| Asians | 90.3 /100 | #126 | Exceptional 86.7% |
| Argentineans | 89.7 /100 | #127 | Excellent 86.7% |
| Yugoslavians | 89.5 /100 | #128 | Excellent 86.7% |
| Immigrants | Ukraine | 88.9 /100 | #129 | Excellent 86.7% |
| Immigrants | Germany | 88.8 /100 | #130 | Excellent 86.7% |
| Immigrants | Spain | 88.5 /100 | #131 | Excellent 86.7% |
| Immigrants | Brazil | 88.4 /100 | #132 | Excellent 86.6% |
| Tsimshian | 88.3 /100 | #133 | Excellent 86.6% |
Demographics Similar to French American Indians by GED/Equivalency
In terms of ged/equivalency, the demographic groups most similar to French American Indians are Immigrants from Thailand (84.5%, a difference of 0.050%), Immigrants from Uzbekistan (84.6%, a difference of 0.070%), Immigrants from Zaire (84.5%, a difference of 0.080%), Iroquois (84.6%, a difference of 0.090%), and Immigrants from Costa Rica (84.5%, a difference of 0.090%).
| Demographics | Rating | Rank | GED/Equivalency |
| Nigerians | 8.6 /100 | #217 | Tragic 84.7% |
| Alaska Natives | 8.6 /100 | #218 | Tragic 84.7% |
| Potawatomi | 8.2 /100 | #219 | Tragic 84.7% |
| Americans | 8.2 /100 | #220 | Tragic 84.7% |
| Taiwanese | 8.1 /100 | #221 | Tragic 84.7% |
| Iroquois | 7.5 /100 | #222 | Tragic 84.6% |
| Immigrants | Uzbekistan | 7.1 /100 | #223 | Tragic 84.6% |
| French American Indians | 6.3 /100 | #224 | Tragic 84.6% |
| Immigrants | Thailand | 5.8 /100 | #225 | Tragic 84.5% |
| Immigrants | Zaire | 5.5 /100 | #226 | Tragic 84.5% |
| Immigrants | Costa Rica | 5.4 /100 | #227 | Tragic 84.5% |
| Immigrants | Liberia | 4.9 /100 | #228 | Tragic 84.4% |
| Immigrants | Uruguay | 4.6 /100 | #229 | Tragic 84.4% |
| Immigrants | Colombia | 4.5 /100 | #230 | Tragic 84.4% |
| Immigrants | Middle Africa | 4.3 /100 | #231 | Tragic 84.4% |