Pakistani vs Immigrants from Jamaica College, 1 year or more
COMPARE
Pakistani
Immigrants from Jamaica
College, 1 year or more
College, 1 year or more Comparison
Pakistanis
Immigrants from Jamaica
61.5%
COLLEGE, 1 YEAR OR MORE
93.2/ 100
METRIC RATING
120th/ 347
METRIC RANK
54.2%
COLLEGE, 1 YEAR OR MORE
0.1/ 100
METRIC RATING
278th/ 347
METRIC RANK
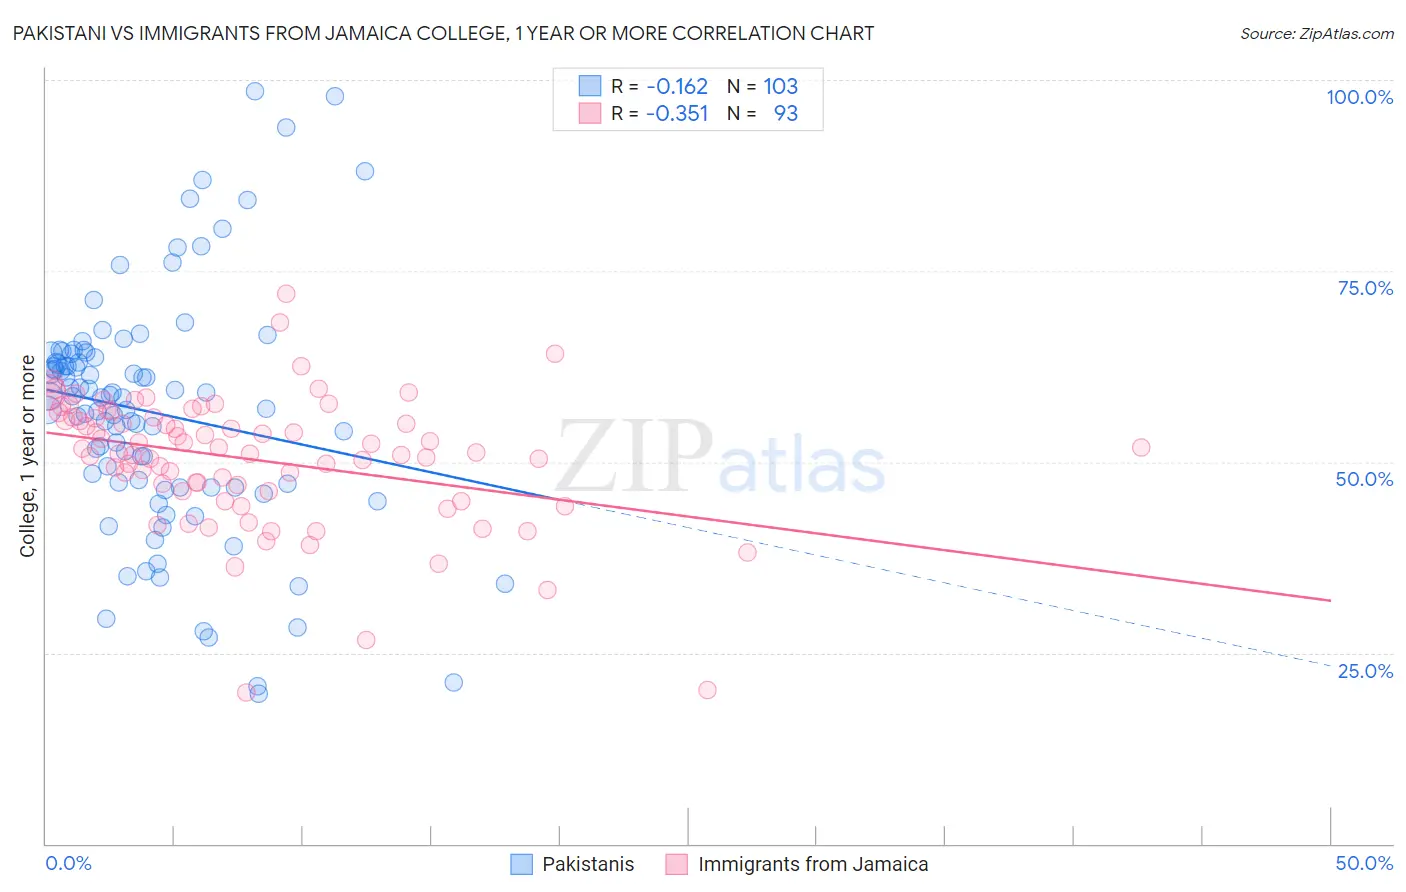
Pakistani vs Immigrants from Jamaica College, 1 year or more Correlation Chart
The statistical analysis conducted on geographies consisting of 335,356,650 people shows a poor negative correlation between the proportion of Pakistanis and percentage of population with at least college, 1 year or more education in the United States with a correlation coefficient (R) of -0.162 and weighted average of 61.5%. Similarly, the statistical analysis conducted on geographies consisting of 301,826,812 people shows a mild negative correlation between the proportion of Immigrants from Jamaica and percentage of population with at least college, 1 year or more education in the United States with a correlation coefficient (R) of -0.351 and weighted average of 54.2%, a difference of 13.5%.
College, 1 year or more Correlation Summary
| Measurement | Pakistani | Immigrants from Jamaica |
| Minimum | 19.6% | 19.8% |
| Maximum | 98.6% | 72.1% |
| Range | 79.0% | 52.3% |
| Mean | 56.5% | 50.3% |
| Median | 58.5% | 51.2% |
| Interquartile 25% (IQ1) | 46.7% | 46.2% |
| Interquartile 75% (IQ3) | 64.1% | 55.9% |
| Interquartile Range (IQR) | 17.4% | 9.7% |
| Standard Deviation (Sample) | 15.7% | 8.7% |
| Standard Deviation (Population) | 15.6% | 8.7% |
Similar Demographics by College, 1 year or more
Demographics Similar to Pakistanis by College, 1 year or more
In terms of college, 1 year or more, the demographic groups most similar to Pakistanis are Assyrian/Chaldean/Syriac (61.5%, a difference of 0.0%), Immigrants from Jordan (61.4%, a difference of 0.10%), Arab (61.6%, a difference of 0.14%), Immigrants from Brazil (61.6%, a difference of 0.14%), and Lebanese (61.6%, a difference of 0.18%).
| Demographics | Rating | Rank | College, 1 year or more |
| Ukrainians | 95.2 /100 | #113 | Exceptional 61.8% |
| Danes | 94.8 /100 | #114 | Exceptional 61.7% |
| Norwegians | 94.5 /100 | #115 | Exceptional 61.7% |
| Lebanese | 94.1 /100 | #116 | Exceptional 61.6% |
| Arabs | 93.9 /100 | #117 | Exceptional 61.6% |
| Immigrants | Brazil | 93.9 /100 | #118 | Exceptional 61.6% |
| Assyrians/Chaldeans/Syriacs | 93.3 /100 | #119 | Exceptional 61.5% |
| Pakistanis | 93.2 /100 | #120 | Exceptional 61.5% |
| Immigrants | Jordan | 92.7 /100 | #121 | Exceptional 61.4% |
| Immigrants | Chile | 92.3 /100 | #122 | Exceptional 61.4% |
| Serbians | 92.2 /100 | #123 | Exceptional 61.4% |
| Venezuelans | 92.1 /100 | #124 | Exceptional 61.3% |
| Immigrants | Syria | 91.6 /100 | #125 | Exceptional 61.3% |
| Alsatians | 91.3 /100 | #126 | Exceptional 61.3% |
| Immigrants | Eastern Africa | 91.1 /100 | #127 | Exceptional 61.2% |
Demographics Similar to Immigrants from Jamaica by College, 1 year or more
In terms of college, 1 year or more, the demographic groups most similar to Immigrants from Jamaica are Arapaho (54.1%, a difference of 0.020%), Cheyenne (54.1%, a difference of 0.070%), Colville (54.1%, a difference of 0.090%), Guyanese (54.1%, a difference of 0.13%), and Ecuadorian (54.3%, a difference of 0.32%).
| Demographics | Rating | Rank | College, 1 year or more |
| Bahamians | 0.2 /100 | #271 | Tragic 54.5% |
| Comanche | 0.2 /100 | #272 | Tragic 54.4% |
| Immigrants | Grenada | 0.2 /100 | #273 | Tragic 54.4% |
| Belizeans | 0.2 /100 | #274 | Tragic 54.4% |
| Americans | 0.2 /100 | #275 | Tragic 54.4% |
| Shoshone | 0.2 /100 | #276 | Tragic 54.3% |
| Ecuadorians | 0.2 /100 | #277 | Tragic 54.3% |
| Immigrants | Jamaica | 0.1 /100 | #278 | Tragic 54.2% |
| Arapaho | 0.1 /100 | #279 | Tragic 54.1% |
| Cheyenne | 0.1 /100 | #280 | Tragic 54.1% |
| Colville | 0.1 /100 | #281 | Tragic 54.1% |
| Guyanese | 0.1 /100 | #282 | Tragic 54.1% |
| Nicaraguans | 0.1 /100 | #283 | Tragic 53.9% |
| Ute | 0.1 /100 | #284 | Tragic 53.8% |
| Immigrants | Guyana | 0.1 /100 | #285 | Tragic 53.5% |