Pakistani vs Immigrants from Egypt College, 1 year or more
COMPARE
Pakistani
Immigrants from Egypt
College, 1 year or more
College, 1 year or more Comparison
Pakistanis
Immigrants from Egypt
61.5%
COLLEGE, 1 YEAR OR MORE
93.2/ 100
METRIC RATING
120th/ 347
METRIC RANK
62.4%
COLLEGE, 1 YEAR OR MORE
97.8/ 100
METRIC RATING
92nd/ 347
METRIC RANK
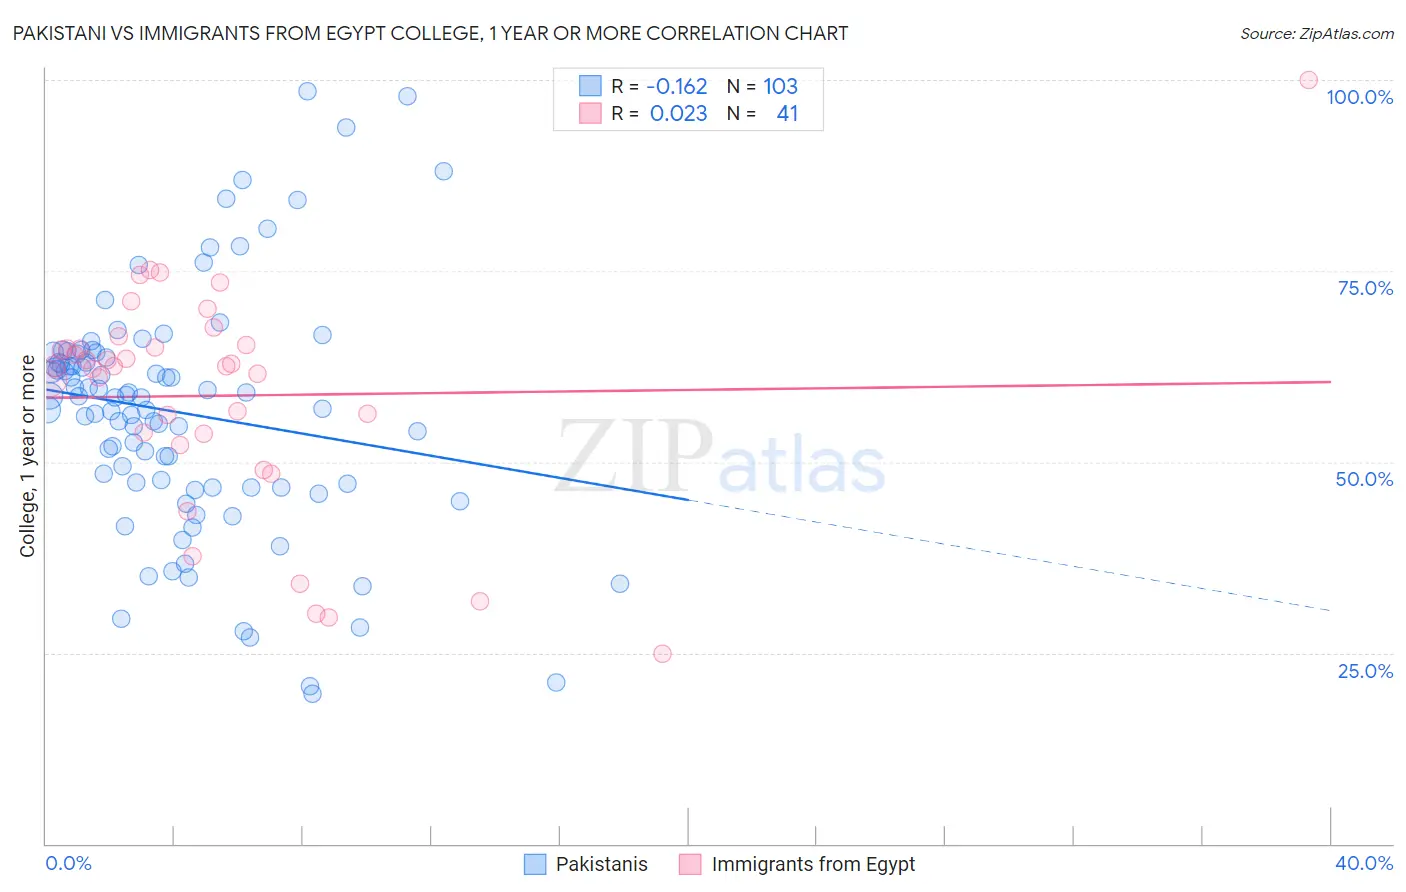
Pakistani vs Immigrants from Egypt College, 1 year or more Correlation Chart
The statistical analysis conducted on geographies consisting of 335,356,650 people shows a poor negative correlation between the proportion of Pakistanis and percentage of population with at least college, 1 year or more education in the United States with a correlation coefficient (R) of -0.162 and weighted average of 61.5%. Similarly, the statistical analysis conducted on geographies consisting of 245,485,794 people shows no correlation between the proportion of Immigrants from Egypt and percentage of population with at least college, 1 year or more education in the United States with a correlation coefficient (R) of 0.023 and weighted average of 62.4%, a difference of 1.5%.
College, 1 year or more Correlation Summary
| Measurement | Pakistani | Immigrants from Egypt |
| Minimum | 19.6% | 24.8% |
| Maximum | 98.6% | 100.0% |
| Range | 79.0% | 75.2% |
| Mean | 56.5% | 58.7% |
| Median | 58.5% | 62.6% |
| Interquartile 25% (IQ1) | 46.7% | 53.0% |
| Interquartile 75% (IQ3) | 64.1% | 65.1% |
| Interquartile Range (IQR) | 17.4% | 12.1% |
| Standard Deviation (Sample) | 15.7% | 14.7% |
| Standard Deviation (Population) | 15.6% | 14.5% |
Similar Demographics by College, 1 year or more
Demographics Similar to Pakistanis by College, 1 year or more
In terms of college, 1 year or more, the demographic groups most similar to Pakistanis are Assyrian/Chaldean/Syriac (61.5%, a difference of 0.0%), Immigrants from Jordan (61.4%, a difference of 0.10%), Arab (61.6%, a difference of 0.14%), Immigrants from Brazil (61.6%, a difference of 0.14%), and Lebanese (61.6%, a difference of 0.18%).
| Demographics | Rating | Rank | College, 1 year or more |
| Ukrainians | 95.2 /100 | #113 | Exceptional 61.8% |
| Danes | 94.8 /100 | #114 | Exceptional 61.7% |
| Norwegians | 94.5 /100 | #115 | Exceptional 61.7% |
| Lebanese | 94.1 /100 | #116 | Exceptional 61.6% |
| Arabs | 93.9 /100 | #117 | Exceptional 61.6% |
| Immigrants | Brazil | 93.9 /100 | #118 | Exceptional 61.6% |
| Assyrians/Chaldeans/Syriacs | 93.3 /100 | #119 | Exceptional 61.5% |
| Pakistanis | 93.2 /100 | #120 | Exceptional 61.5% |
| Immigrants | Jordan | 92.7 /100 | #121 | Exceptional 61.4% |
| Immigrants | Chile | 92.3 /100 | #122 | Exceptional 61.4% |
| Serbians | 92.2 /100 | #123 | Exceptional 61.4% |
| Venezuelans | 92.1 /100 | #124 | Exceptional 61.3% |
| Immigrants | Syria | 91.6 /100 | #125 | Exceptional 61.3% |
| Alsatians | 91.3 /100 | #126 | Exceptional 61.3% |
| Immigrants | Eastern Africa | 91.1 /100 | #127 | Exceptional 61.2% |
Demographics Similar to Immigrants from Egypt by College, 1 year or more
In terms of college, 1 year or more, the demographic groups most similar to Immigrants from Egypt are Immigrants from Eastern Europe (62.4%, a difference of 0.010%), Romanian (62.4%, a difference of 0.030%), Immigrants from Croatia (62.3%, a difference of 0.090%), Immigrants from Western Asia (62.5%, a difference of 0.11%), and British (62.3%, a difference of 0.19%).
| Demographics | Rating | Rank | College, 1 year or more |
| Immigrants | Pakistan | 98.6 /100 | #85 | Exceptional 62.8% |
| Immigrants | Western Europe | 98.6 /100 | #86 | Exceptional 62.7% |
| Immigrants | Hungary | 98.6 /100 | #87 | Exceptional 62.7% |
| Greeks | 98.3 /100 | #88 | Exceptional 62.6% |
| Immigrants | Ethiopia | 98.2 /100 | #89 | Exceptional 62.6% |
| Immigrants | Western Asia | 97.9 /100 | #90 | Exceptional 62.5% |
| Immigrants | Eastern Europe | 97.8 /100 | #91 | Exceptional 62.4% |
| Immigrants | Egypt | 97.8 /100 | #92 | Exceptional 62.4% |
| Romanians | 97.7 /100 | #93 | Exceptional 62.4% |
| Immigrants | Croatia | 97.6 /100 | #94 | Exceptional 62.3% |
| British | 97.4 /100 | #95 | Exceptional 62.3% |
| Chinese | 97.2 /100 | #96 | Exceptional 62.2% |
| Jordanians | 97.2 /100 | #97 | Exceptional 62.2% |
| Carpatho Rusyns | 97.2 /100 | #98 | Exceptional 62.2% |
| Croatians | 97.1 /100 | #99 | Exceptional 62.2% |