Pakistani vs Crow Family Poverty
COMPARE
Pakistani
Crow
Family Poverty
Family Poverty Comparison
Pakistanis
Crow
8.3%
FAMILY POVERTY
90.8/ 100
METRIC RATING
125th/ 347
METRIC RANK
16.1%
FAMILY POVERTY
0.0/ 100
METRIC RATING
338th/ 347
METRIC RANK
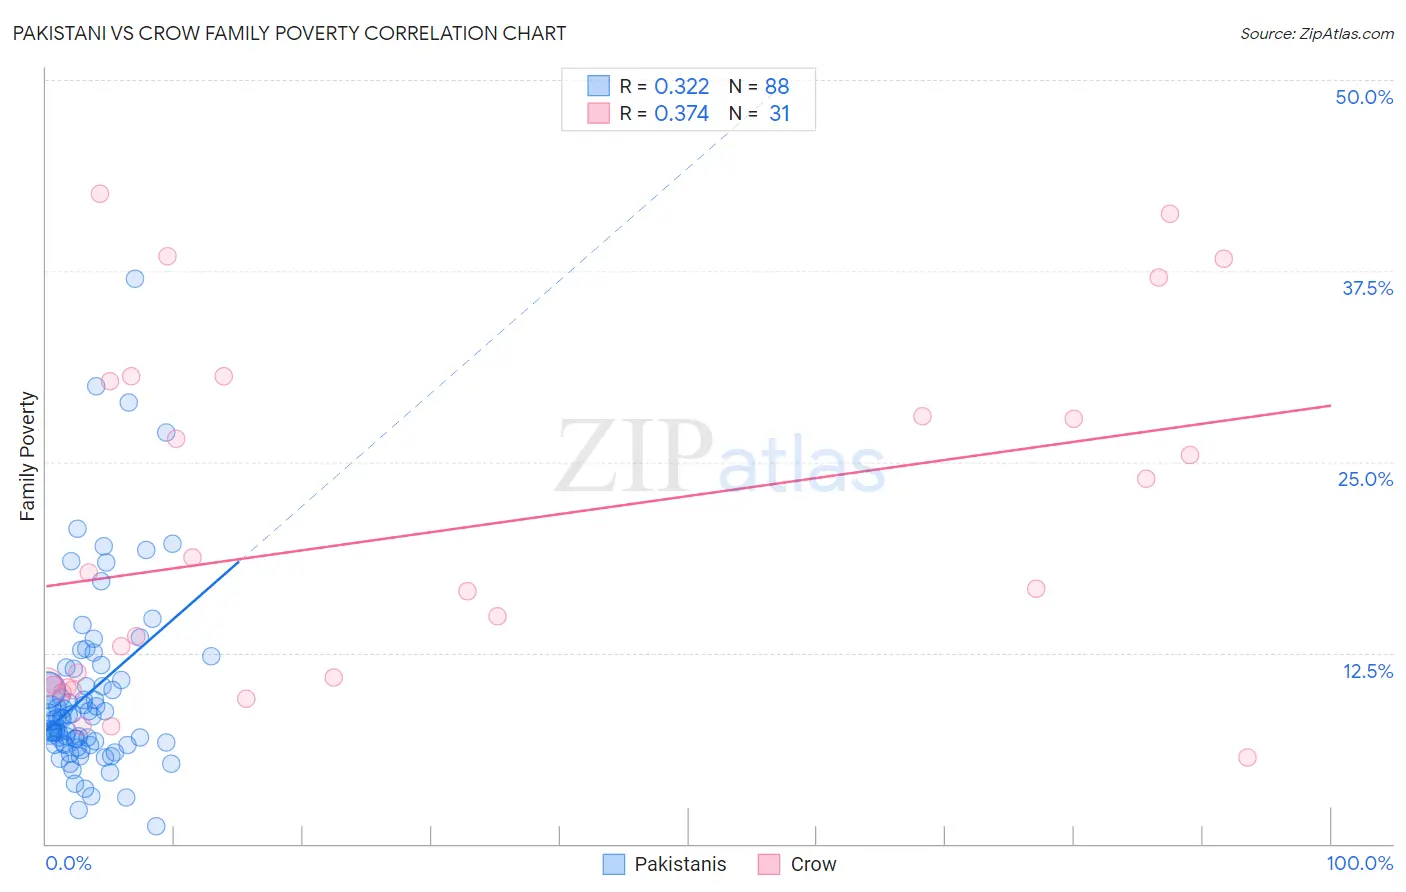
Pakistani vs Crow Family Poverty Correlation Chart
The statistical analysis conducted on geographies consisting of 334,856,676 people shows a mild positive correlation between the proportion of Pakistanis and poverty level among families in the United States with a correlation coefficient (R) of 0.322 and weighted average of 8.3%. Similarly, the statistical analysis conducted on geographies consisting of 59,176,312 people shows a mild positive correlation between the proportion of Crow and poverty level among families in the United States with a correlation coefficient (R) of 0.374 and weighted average of 16.1%, a difference of 93.3%.
Family Poverty Correlation Summary
| Measurement | Pakistani | Crow |
| Minimum | 1.2% | 5.7% |
| Maximum | 37.0% | 42.6% |
| Range | 35.8% | 36.9% |
| Mean | 9.9% | 20.5% |
| Median | 8.3% | 16.7% |
| Interquartile 25% (IQ1) | 6.5% | 10.4% |
| Interquartile 75% (IQ3) | 11.1% | 30.3% |
| Interquartile Range (IQR) | 4.6% | 19.9% |
| Standard Deviation (Sample) | 6.1% | 11.4% |
| Standard Deviation (Population) | 6.1% | 11.2% |
Similar Demographics by Family Poverty
Demographics Similar to Pakistanis by Family Poverty
In terms of family poverty, the demographic groups most similar to Pakistanis are Soviet Union (8.3%, a difference of 0.040%), Palestinian (8.3%, a difference of 0.14%), Icelander (8.3%, a difference of 0.20%), Paraguayan (8.3%, a difference of 0.21%), and Native Hawaiian (8.3%, a difference of 0.22%).
| Demographics | Rating | Rank | Family Poverty |
| Immigrants | Western Europe | 92.9 /100 | #118 | Exceptional 8.2% |
| French | 92.8 /100 | #119 | Exceptional 8.3% |
| Immigrants | Egypt | 91.6 /100 | #120 | Exceptional 8.3% |
| Native Hawaiians | 91.3 /100 | #121 | Exceptional 8.3% |
| Paraguayans | 91.2 /100 | #122 | Exceptional 8.3% |
| Palestinians | 91.1 /100 | #123 | Exceptional 8.3% |
| Soviet Union | 90.8 /100 | #124 | Exceptional 8.3% |
| Pakistanis | 90.8 /100 | #125 | Exceptional 8.3% |
| Icelanders | 90.3 /100 | #126 | Exceptional 8.3% |
| Immigrants | Hungary | 89.9 /100 | #127 | Excellent 8.4% |
| Argentineans | 89.6 /100 | #128 | Excellent 8.4% |
| Portuguese | 89.2 /100 | #129 | Excellent 8.4% |
| Immigrants | Bosnia and Herzegovina | 88.6 /100 | #130 | Excellent 8.4% |
| Puget Sound Salish | 88.6 /100 | #131 | Excellent 8.4% |
| Immigrants | Argentina | 88.2 /100 | #132 | Excellent 8.4% |
Demographics Similar to Crow by Family Poverty
In terms of family poverty, the demographic groups most similar to Crow are Hopi (15.9%, a difference of 1.1%), Sioux (15.9%, a difference of 1.6%), Yuman (16.6%, a difference of 3.3%), Pueblo (17.0%, a difference of 5.4%), and Lumbee (17.0%, a difference of 5.5%).
| Demographics | Rating | Rank | Family Poverty |
| Cheyenne | 0.0 /100 | #331 | Tragic 14.3% |
| Dominicans | 0.0 /100 | #332 | Tragic 14.3% |
| Immigrants | Dominican Republic | 0.0 /100 | #333 | Tragic 14.4% |
| Houma | 0.0 /100 | #334 | Tragic 14.6% |
| Apache | 0.0 /100 | #335 | Tragic 14.7% |
| Sioux | 0.0 /100 | #336 | Tragic 15.9% |
| Hopi | 0.0 /100 | #337 | Tragic 15.9% |
| Crow | 0.0 /100 | #338 | Tragic 16.1% |
| Yuman | 0.0 /100 | #339 | Tragic 16.6% |
| Pueblo | 0.0 /100 | #340 | Tragic 17.0% |
| Lumbee | 0.0 /100 | #341 | Tragic 17.0% |
| Immigrants | Yemen | 0.0 /100 | #342 | Tragic 17.5% |
| Pima | 0.0 /100 | #343 | Tragic 18.4% |
| Yup'ik | 0.0 /100 | #344 | Tragic 18.7% |
| Navajo | 0.0 /100 | #345 | Tragic 18.8% |