Nigerian vs Croatian GED/Equivalency
COMPARE
Nigerian
Croatian
GED/Equivalency
GED/Equivalency Comparison
Nigerians
Croatians
84.7%
GED/EQUIVALENCY
8.6/ 100
METRIC RATING
217th/ 347
METRIC RANK
88.8%
GED/EQUIVALENCY
99.9/ 100
METRIC RATING
17th/ 347
METRIC RANK
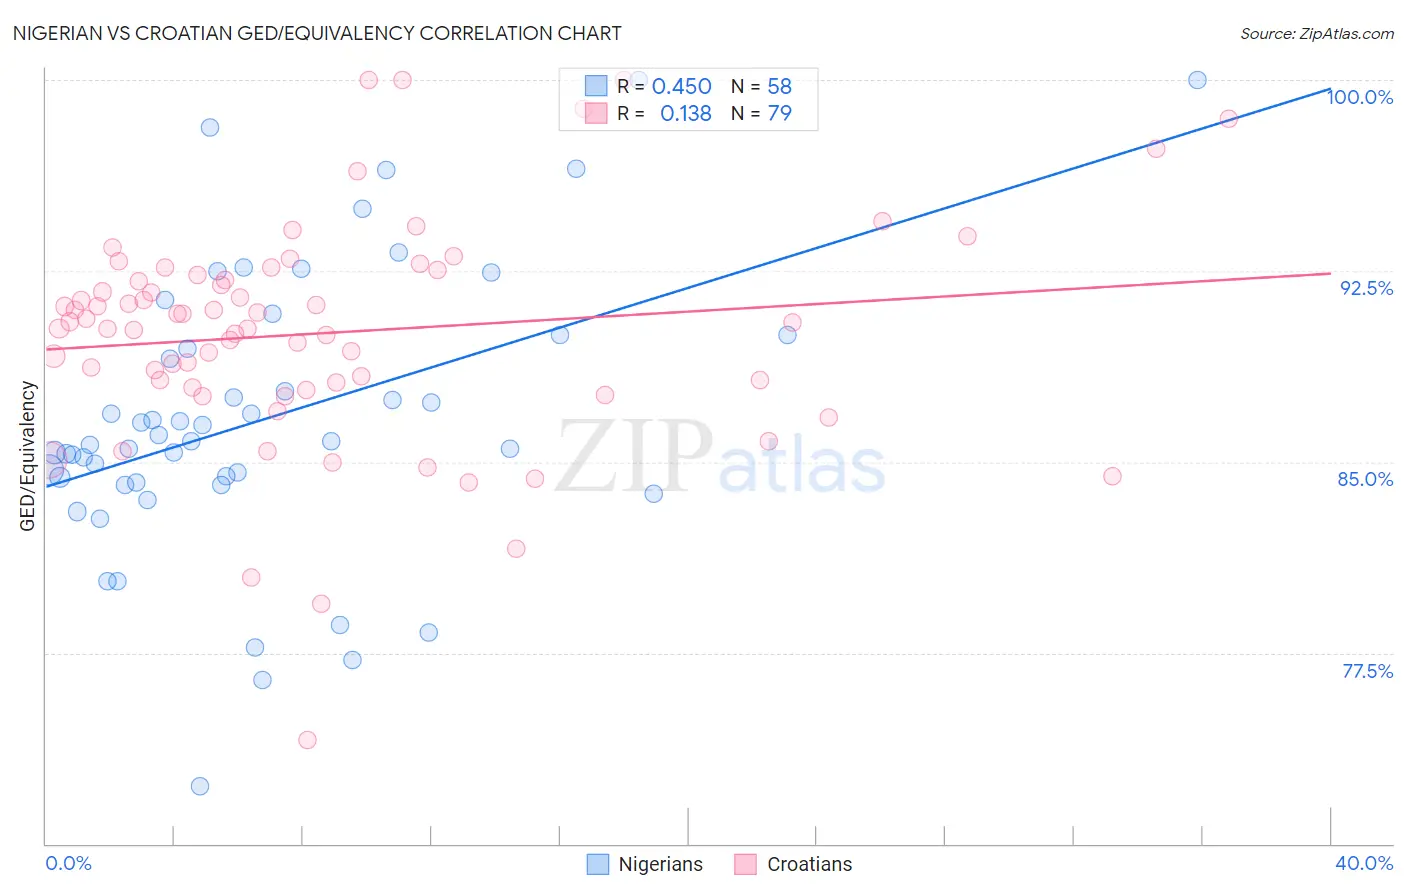
Nigerian vs Croatian GED/Equivalency Correlation Chart
The statistical analysis conducted on geographies consisting of 332,724,627 people shows a moderate positive correlation between the proportion of Nigerians and percentage of population with at least ged/equivalency education in the United States with a correlation coefficient (R) of 0.450 and weighted average of 84.7%. Similarly, the statistical analysis conducted on geographies consisting of 375,732,690 people shows a poor positive correlation between the proportion of Croatians and percentage of population with at least ged/equivalency education in the United States with a correlation coefficient (R) of 0.138 and weighted average of 88.8%, a difference of 4.9%.
GED/Equivalency Correlation Summary
| Measurement | Nigerian | Croatian |
| Minimum | 72.2% | 74.1% |
| Maximum | 100.0% | 100.0% |
| Range | 27.8% | 25.9% |
| Mean | 86.7% | 90.1% |
| Median | 85.8% | 90.5% |
| Interquartile 25% (IQ1) | 84.2% | 87.9% |
| Interquartile 75% (IQ3) | 90.0% | 92.3% |
| Interquartile Range (IQR) | 5.8% | 4.4% |
| Standard Deviation (Sample) | 5.6% | 4.5% |
| Standard Deviation (Population) | 5.6% | 4.4% |
Similar Demographics by GED/Equivalency
Demographics Similar to Nigerians by GED/Equivalency
In terms of ged/equivalency, the demographic groups most similar to Nigerians are Immigrants from Micronesia (84.7%, a difference of 0.0%), Alaska Native (84.7%, a difference of 0.0%), Peruvian (84.7%, a difference of 0.030%), Potawatomi (84.7%, a difference of 0.030%), and American (84.7%, a difference of 0.030%).
| Demographics | Rating | Rank | GED/Equivalency |
| Immigrants | Cameroon | 12.1 /100 | #210 | Poor 84.9% |
| South Americans | 10.9 /100 | #211 | Poor 84.8% |
| Immigrants | Somalia | 10.6 /100 | #212 | Poor 84.8% |
| Immigrants | Philippines | 10.0 /100 | #213 | Poor 84.8% |
| Osage | 9.5 /100 | #214 | Tragic 84.8% |
| Peruvians | 9.2 /100 | #215 | Tragic 84.7% |
| Immigrants | Micronesia | 8.7 /100 | #216 | Tragic 84.7% |
| Nigerians | 8.6 /100 | #217 | Tragic 84.7% |
| Alaska Natives | 8.6 /100 | #218 | Tragic 84.7% |
| Potawatomi | 8.2 /100 | #219 | Tragic 84.7% |
| Americans | 8.2 /100 | #220 | Tragic 84.7% |
| Taiwanese | 8.1 /100 | #221 | Tragic 84.7% |
| Iroquois | 7.5 /100 | #222 | Tragic 84.6% |
| Immigrants | Uzbekistan | 7.1 /100 | #223 | Tragic 84.6% |
| French American Indians | 6.3 /100 | #224 | Tragic 84.6% |
Demographics Similar to Croatians by GED/Equivalency
In terms of ged/equivalency, the demographic groups most similar to Croatians are Immigrants from Taiwan (88.8%, a difference of 0.030%), Slovene (88.8%, a difference of 0.030%), Okinawan (88.9%, a difference of 0.060%), Cypriot (88.9%, a difference of 0.080%), and Swedish (88.8%, a difference of 0.080%).
| Demographics | Rating | Rank | GED/Equivalency |
| Norwegians | 99.9 /100 | #10 | Exceptional 89.0% |
| Bulgarians | 99.9 /100 | #11 | Exceptional 89.0% |
| Lithuanians | 99.9 /100 | #12 | Exceptional 88.9% |
| Immigrants | Iran | 99.9 /100 | #13 | Exceptional 88.9% |
| Cypriots | 99.9 /100 | #14 | Exceptional 88.9% |
| Okinawans | 99.9 /100 | #15 | Exceptional 88.9% |
| Immigrants | Taiwan | 99.9 /100 | #16 | Exceptional 88.8% |
| Croatians | 99.9 /100 | #17 | Exceptional 88.8% |
| Slovenes | 99.9 /100 | #18 | Exceptional 88.8% |
| Swedes | 99.9 /100 | #19 | Exceptional 88.8% |
| Maltese | 99.9 /100 | #20 | Exceptional 88.6% |
| Luxembourgers | 99.8 /100 | #21 | Exceptional 88.6% |
| Immigrants | Ireland | 99.8 /100 | #22 | Exceptional 88.6% |
| Russians | 99.8 /100 | #23 | Exceptional 88.6% |
| Slovaks | 99.8 /100 | #24 | Exceptional 88.6% |