Nigerian vs Bermudan GED/Equivalency
COMPARE
Nigerian
Bermudan
GED/Equivalency
GED/Equivalency Comparison
Nigerians
Bermudans
84.7%
GED/EQUIVALENCY
8.6/ 100
METRIC RATING
217th/ 347
METRIC RANK
85.8%
GED/EQUIVALENCY
55.1/ 100
METRIC RATING
172nd/ 347
METRIC RANK
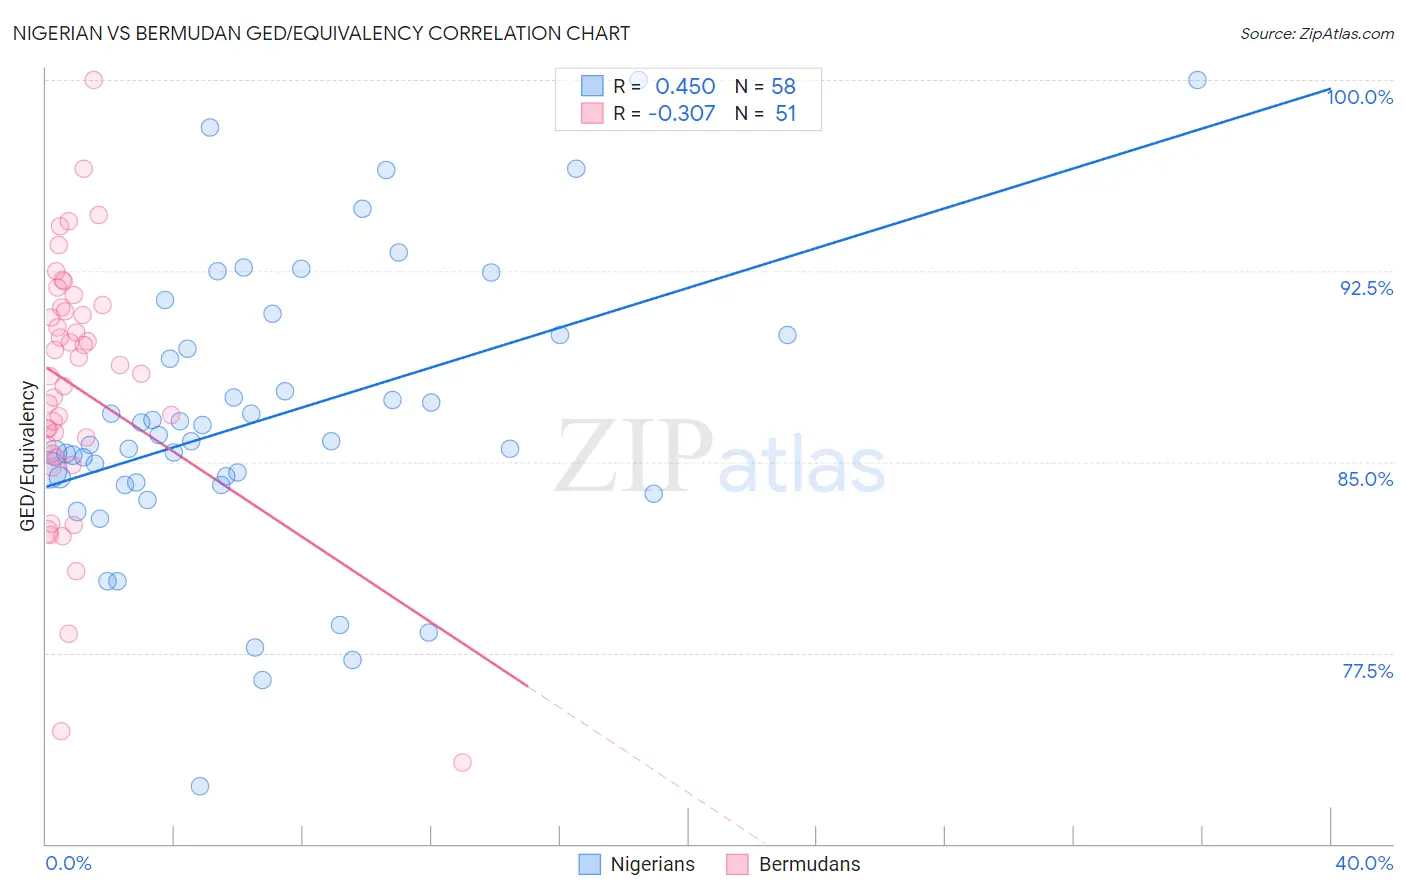
Nigerian vs Bermudan GED/Equivalency Correlation Chart
The statistical analysis conducted on geographies consisting of 332,724,627 people shows a moderate positive correlation between the proportion of Nigerians and percentage of population with at least ged/equivalency education in the United States with a correlation coefficient (R) of 0.450 and weighted average of 84.7%. Similarly, the statistical analysis conducted on geographies consisting of 55,728,561 people shows a mild negative correlation between the proportion of Bermudans and percentage of population with at least ged/equivalency education in the United States with a correlation coefficient (R) of -0.307 and weighted average of 85.8%, a difference of 1.3%.
GED/Equivalency Correlation Summary
| Measurement | Nigerian | Bermudan |
| Minimum | 72.2% | 73.2% |
| Maximum | 100.0% | 100.0% |
| Range | 27.8% | 26.8% |
| Mean | 86.7% | 87.9% |
| Median | 85.8% | 88.5% |
| Interquartile 25% (IQ1) | 84.2% | 85.3% |
| Interquartile 75% (IQ3) | 90.0% | 91.1% |
| Interquartile Range (IQR) | 5.8% | 5.8% |
| Standard Deviation (Sample) | 5.6% | 5.1% |
| Standard Deviation (Population) | 5.6% | 5.0% |
Similar Demographics by GED/Equivalency
Demographics Similar to Nigerians by GED/Equivalency
In terms of ged/equivalency, the demographic groups most similar to Nigerians are Immigrants from Micronesia (84.7%, a difference of 0.0%), Alaska Native (84.7%, a difference of 0.0%), Peruvian (84.7%, a difference of 0.030%), Potawatomi (84.7%, a difference of 0.030%), and American (84.7%, a difference of 0.030%).
| Demographics | Rating | Rank | GED/Equivalency |
| Immigrants | Cameroon | 12.1 /100 | #210 | Poor 84.9% |
| South Americans | 10.9 /100 | #211 | Poor 84.8% |
| Immigrants | Somalia | 10.6 /100 | #212 | Poor 84.8% |
| Immigrants | Philippines | 10.0 /100 | #213 | Poor 84.8% |
| Osage | 9.5 /100 | #214 | Tragic 84.8% |
| Peruvians | 9.2 /100 | #215 | Tragic 84.7% |
| Immigrants | Micronesia | 8.7 /100 | #216 | Tragic 84.7% |
| Nigerians | 8.6 /100 | #217 | Tragic 84.7% |
| Alaska Natives | 8.6 /100 | #218 | Tragic 84.7% |
| Potawatomi | 8.2 /100 | #219 | Tragic 84.7% |
| Americans | 8.2 /100 | #220 | Tragic 84.7% |
| Taiwanese | 8.1 /100 | #221 | Tragic 84.7% |
| Iroquois | 7.5 /100 | #222 | Tragic 84.6% |
| Immigrants | Uzbekistan | 7.1 /100 | #223 | Tragic 84.6% |
| French American Indians | 6.3 /100 | #224 | Tragic 84.6% |
Demographics Similar to Bermudans by GED/Equivalency
In terms of ged/equivalency, the demographic groups most similar to Bermudans are Immigrants from Chile (85.9%, a difference of 0.050%), Immigrants from Venezuela (85.8%, a difference of 0.090%), Afghan (85.9%, a difference of 0.10%), Ottawa (85.8%, a difference of 0.10%), and Immigrants from Bolivia (85.8%, a difference of 0.11%).
| Demographics | Rating | Rank | GED/Equivalency |
| Alsatians | 64.3 /100 | #165 | Good 86.0% |
| Immigrants | Albania | 64.2 /100 | #166 | Good 86.0% |
| Ethiopians | 63.7 /100 | #167 | Good 86.0% |
| Sierra Leoneans | 61.8 /100 | #168 | Good 86.0% |
| Immigrants | Ethiopia | 61.2 /100 | #169 | Good 86.0% |
| Afghans | 59.7 /100 | #170 | Average 85.9% |
| Immigrants | Chile | 57.3 /100 | #171 | Average 85.9% |
| Bermudans | 55.1 /100 | #172 | Average 85.8% |
| Immigrants | Venezuela | 50.7 /100 | #173 | Average 85.8% |
| Ottawa | 50.0 /100 | #174 | Average 85.8% |
| Immigrants | Bolivia | 49.8 /100 | #175 | Average 85.8% |
| Immigrants | Eastern Africa | 47.7 /100 | #176 | Average 85.7% |
| Immigrants | Uganda | 45.2 /100 | #177 | Average 85.7% |
| Koreans | 41.2 /100 | #178 | Average 85.6% |
| Aleuts | 40.5 /100 | #179 | Average 85.6% |