Nigerian vs Syrian GED/Equivalency
COMPARE
Nigerian
Syrian
GED/Equivalency
GED/Equivalency Comparison
Nigerians
Syrians
84.7%
GED/EQUIVALENCY
8.6/ 100
METRIC RATING
217th/ 347
METRIC RANK
87.2%
GED/EQUIVALENCY
96.6/ 100
METRIC RATING
101st/ 347
METRIC RANK
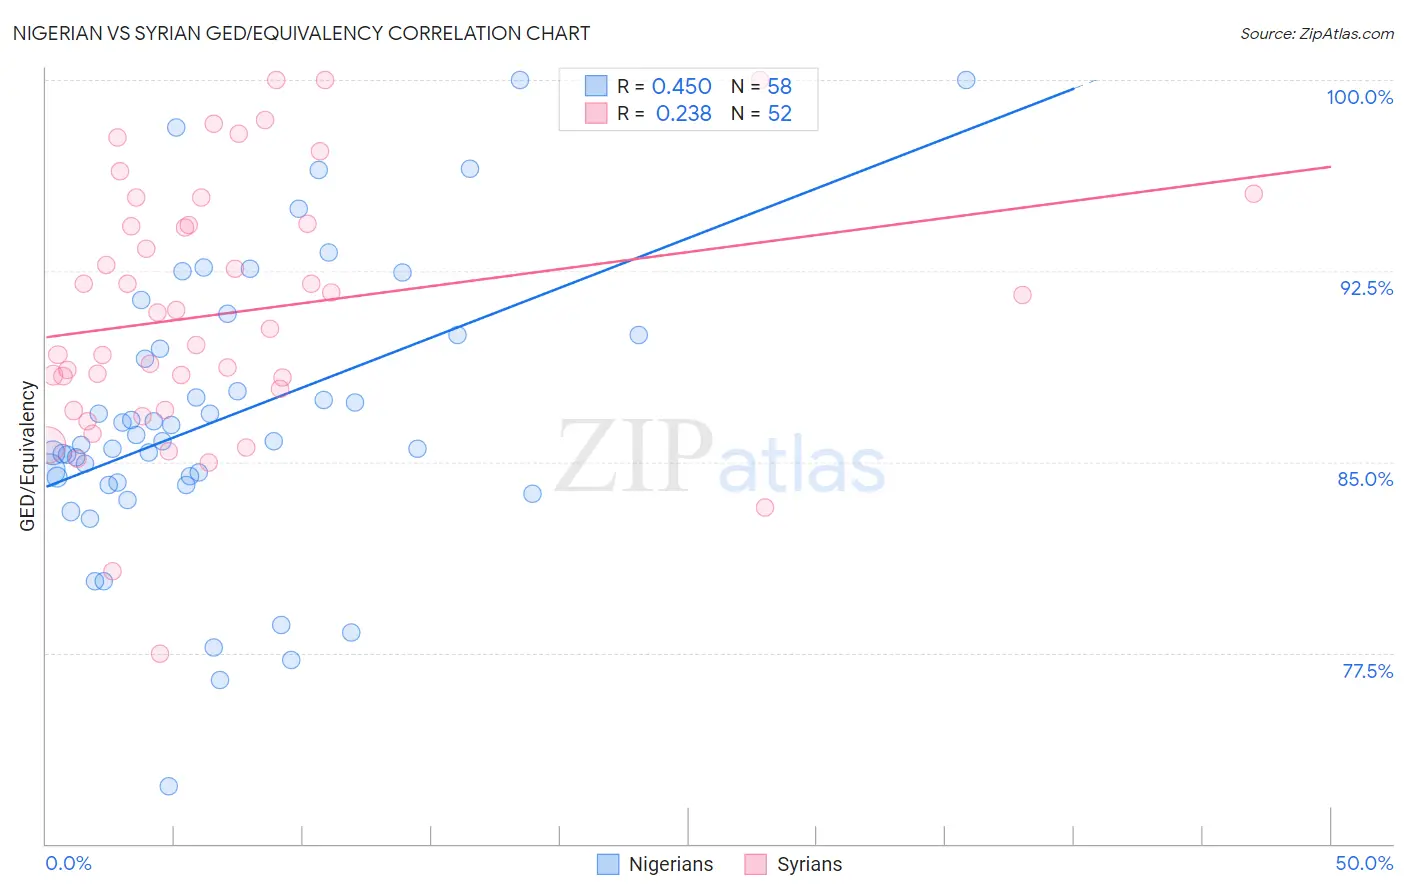
Nigerian vs Syrian GED/Equivalency Correlation Chart
The statistical analysis conducted on geographies consisting of 332,724,627 people shows a moderate positive correlation between the proportion of Nigerians and percentage of population with at least ged/equivalency education in the United States with a correlation coefficient (R) of 0.450 and weighted average of 84.7%. Similarly, the statistical analysis conducted on geographies consisting of 266,306,452 people shows a weak positive correlation between the proportion of Syrians and percentage of population with at least ged/equivalency education in the United States with a correlation coefficient (R) of 0.238 and weighted average of 87.2%, a difference of 3.0%.
GED/Equivalency Correlation Summary
| Measurement | Nigerian | Syrian |
| Minimum | 72.2% | 77.5% |
| Maximum | 100.0% | 100.0% |
| Range | 27.8% | 22.5% |
| Mean | 86.7% | 90.9% |
| Median | 85.8% | 90.6% |
| Interquartile 25% (IQ1) | 84.2% | 87.4% |
| Interquartile 75% (IQ3) | 90.0% | 94.3% |
| Interquartile Range (IQR) | 5.8% | 6.9% |
| Standard Deviation (Sample) | 5.6% | 5.0% |
| Standard Deviation (Population) | 5.6% | 5.0% |
Similar Demographics by GED/Equivalency
Demographics Similar to Nigerians by GED/Equivalency
In terms of ged/equivalency, the demographic groups most similar to Nigerians are Immigrants from Micronesia (84.7%, a difference of 0.0%), Alaska Native (84.7%, a difference of 0.0%), Peruvian (84.7%, a difference of 0.030%), Potawatomi (84.7%, a difference of 0.030%), and American (84.7%, a difference of 0.030%).
| Demographics | Rating | Rank | GED/Equivalency |
| Immigrants | Cameroon | 12.1 /100 | #210 | Poor 84.9% |
| South Americans | 10.9 /100 | #211 | Poor 84.8% |
| Immigrants | Somalia | 10.6 /100 | #212 | Poor 84.8% |
| Immigrants | Philippines | 10.0 /100 | #213 | Poor 84.8% |
| Osage | 9.5 /100 | #214 | Tragic 84.8% |
| Peruvians | 9.2 /100 | #215 | Tragic 84.7% |
| Immigrants | Micronesia | 8.7 /100 | #216 | Tragic 84.7% |
| Nigerians | 8.6 /100 | #217 | Tragic 84.7% |
| Alaska Natives | 8.6 /100 | #218 | Tragic 84.7% |
| Potawatomi | 8.2 /100 | #219 | Tragic 84.7% |
| Americans | 8.2 /100 | #220 | Tragic 84.7% |
| Taiwanese | 8.1 /100 | #221 | Tragic 84.7% |
| Iroquois | 7.5 /100 | #222 | Tragic 84.6% |
| Immigrants | Uzbekistan | 7.1 /100 | #223 | Tragic 84.6% |
| French American Indians | 6.3 /100 | #224 | Tragic 84.6% |
Demographics Similar to Syrians by GED/Equivalency
In terms of ged/equivalency, the demographic groups most similar to Syrians are Palestinian (87.3%, a difference of 0.030%), Immigrants from Belarus (87.3%, a difference of 0.050%), Immigrants from Croatia (87.3%, a difference of 0.060%), Lebanese (87.2%, a difference of 0.060%), and Jordanian (87.2%, a difference of 0.070%).
| Demographics | Rating | Rank | GED/Equivalency |
| Immigrants | Russia | 97.8 /100 | #94 | Exceptional 87.4% |
| Immigrants | Greece | 97.7 /100 | #95 | Exceptional 87.4% |
| Czechoslovakians | 97.6 /100 | #96 | Exceptional 87.4% |
| Immigrants | Western Europe | 97.3 /100 | #97 | Exceptional 87.3% |
| Immigrants | Croatia | 96.9 /100 | #98 | Exceptional 87.3% |
| Immigrants | Belarus | 96.9 /100 | #99 | Exceptional 87.3% |
| Palestinians | 96.8 /100 | #100 | Exceptional 87.3% |
| Syrians | 96.6 /100 | #101 | Exceptional 87.2% |
| Lebanese | 96.2 /100 | #102 | Exceptional 87.2% |
| Jordanians | 96.1 /100 | #103 | Exceptional 87.2% |
| Immigrants | Hungary | 96.0 /100 | #104 | Exceptional 87.2% |
| Indians (Asian) | 95.9 /100 | #105 | Exceptional 87.1% |
| Immigrants | Zimbabwe | 95.8 /100 | #106 | Exceptional 87.1% |
| Icelanders | 95.7 /100 | #107 | Exceptional 87.1% |
| Canadians | 95.6 /100 | #108 | Exceptional 87.1% |