Nigerian vs Polish GED/Equivalency
COMPARE
Nigerian
Polish
GED/Equivalency
GED/Equivalency Comparison
Nigerians
Poles
84.7%
GED/EQUIVALENCY
8.6/ 100
METRIC RATING
217th/ 347
METRIC RANK
88.5%
GED/EQUIVALENCY
99.8/ 100
METRIC RATING
29th/ 347
METRIC RANK
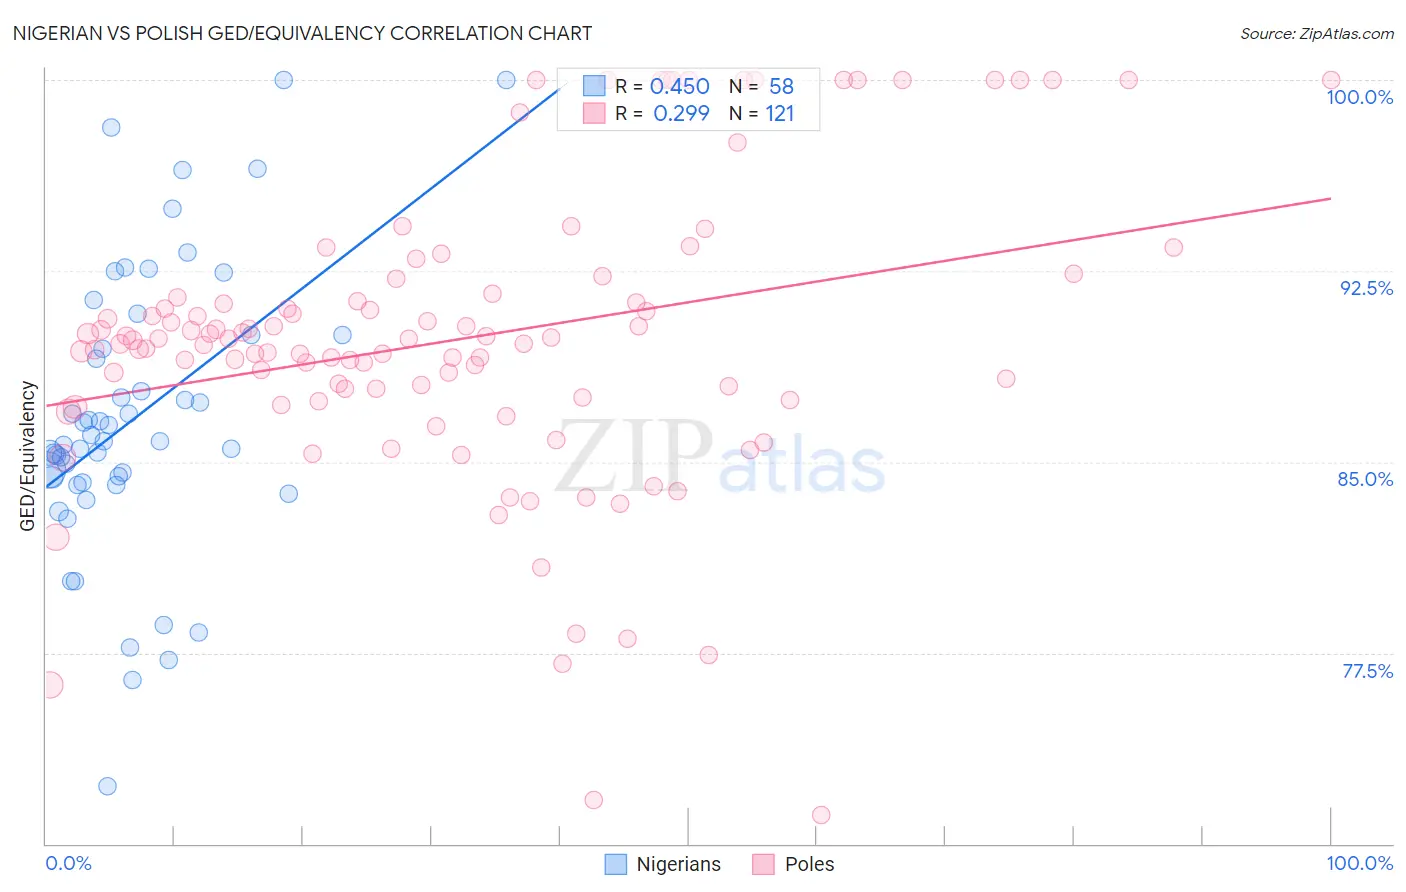
Nigerian vs Polish GED/Equivalency Correlation Chart
The statistical analysis conducted on geographies consisting of 332,724,627 people shows a moderate positive correlation between the proportion of Nigerians and percentage of population with at least ged/equivalency education in the United States with a correlation coefficient (R) of 0.450 and weighted average of 84.7%. Similarly, the statistical analysis conducted on geographies consisting of 560,593,858 people shows a weak positive correlation between the proportion of Poles and percentage of population with at least ged/equivalency education in the United States with a correlation coefficient (R) of 0.299 and weighted average of 88.5%, a difference of 4.4%.
GED/Equivalency Correlation Summary
| Measurement | Nigerian | Polish |
| Minimum | 72.2% | 71.1% |
| Maximum | 100.0% | 100.0% |
| Range | 27.8% | 28.9% |
| Mean | 86.7% | 89.8% |
| Median | 85.8% | 89.8% |
| Interquartile 25% (IQ1) | 84.2% | 87.5% |
| Interquartile 75% (IQ3) | 90.0% | 91.5% |
| Interquartile Range (IQR) | 5.8% | 4.1% |
| Standard Deviation (Sample) | 5.6% | 5.8% |
| Standard Deviation (Population) | 5.6% | 5.8% |
Similar Demographics by GED/Equivalency
Demographics Similar to Nigerians by GED/Equivalency
In terms of ged/equivalency, the demographic groups most similar to Nigerians are Immigrants from Micronesia (84.7%, a difference of 0.0%), Alaska Native (84.7%, a difference of 0.0%), Peruvian (84.7%, a difference of 0.030%), Potawatomi (84.7%, a difference of 0.030%), and American (84.7%, a difference of 0.030%).
| Demographics | Rating | Rank | GED/Equivalency |
| Immigrants | Cameroon | 12.1 /100 | #210 | Poor 84.9% |
| South Americans | 10.9 /100 | #211 | Poor 84.8% |
| Immigrants | Somalia | 10.6 /100 | #212 | Poor 84.8% |
| Immigrants | Philippines | 10.0 /100 | #213 | Poor 84.8% |
| Osage | 9.5 /100 | #214 | Tragic 84.8% |
| Peruvians | 9.2 /100 | #215 | Tragic 84.7% |
| Immigrants | Micronesia | 8.7 /100 | #216 | Tragic 84.7% |
| Nigerians | 8.6 /100 | #217 | Tragic 84.7% |
| Alaska Natives | 8.6 /100 | #218 | Tragic 84.7% |
| Potawatomi | 8.2 /100 | #219 | Tragic 84.7% |
| Americans | 8.2 /100 | #220 | Tragic 84.7% |
| Taiwanese | 8.1 /100 | #221 | Tragic 84.7% |
| Iroquois | 7.5 /100 | #222 | Tragic 84.6% |
| Immigrants | Uzbekistan | 7.1 /100 | #223 | Tragic 84.6% |
| French American Indians | 6.3 /100 | #224 | Tragic 84.6% |
Demographics Similar to Poles by GED/Equivalency
In terms of ged/equivalency, the demographic groups most similar to Poles are Turkish (88.5%, a difference of 0.020%), Immigrants from Northern Europe (88.5%, a difference of 0.030%), Bhutanese (88.4%, a difference of 0.050%), Immigrants from Lithuania (88.6%, a difference of 0.070%), and Danish (88.4%, a difference of 0.070%).
| Demographics | Rating | Rank | GED/Equivalency |
| Immigrants | Ireland | 99.8 /100 | #22 | Exceptional 88.6% |
| Russians | 99.8 /100 | #23 | Exceptional 88.6% |
| Slovaks | 99.8 /100 | #24 | Exceptional 88.6% |
| Estonians | 99.8 /100 | #25 | Exceptional 88.6% |
| Immigrants | Australia | 99.8 /100 | #26 | Exceptional 88.6% |
| Immigrants | Lithuania | 99.8 /100 | #27 | Exceptional 88.6% |
| Immigrants | Northern Europe | 99.8 /100 | #28 | Exceptional 88.5% |
| Poles | 99.8 /100 | #29 | Exceptional 88.5% |
| Turks | 99.8 /100 | #30 | Exceptional 88.5% |
| Bhutanese | 99.8 /100 | #31 | Exceptional 88.4% |
| Danes | 99.8 /100 | #32 | Exceptional 88.4% |
| Immigrants | Sweden | 99.7 /100 | #33 | Exceptional 88.4% |
| Immigrants | Japan | 99.7 /100 | #34 | Exceptional 88.4% |
| Immigrants | South Central Asia | 99.7 /100 | #35 | Exceptional 88.4% |
| Immigrants | Belgium | 99.7 /100 | #36 | Exceptional 88.3% |