Immigrants from Belize vs Croatian GED/Equivalency
COMPARE
Immigrants from Belize
Croatian
GED/Equivalency
GED/Equivalency Comparison
Immigrants from Belize
Croatians
80.5%
GED/EQUIVALENCY
0.0/ 100
METRIC RATING
319th/ 347
METRIC RANK
88.8%
GED/EQUIVALENCY
99.9/ 100
METRIC RATING
17th/ 347
METRIC RANK
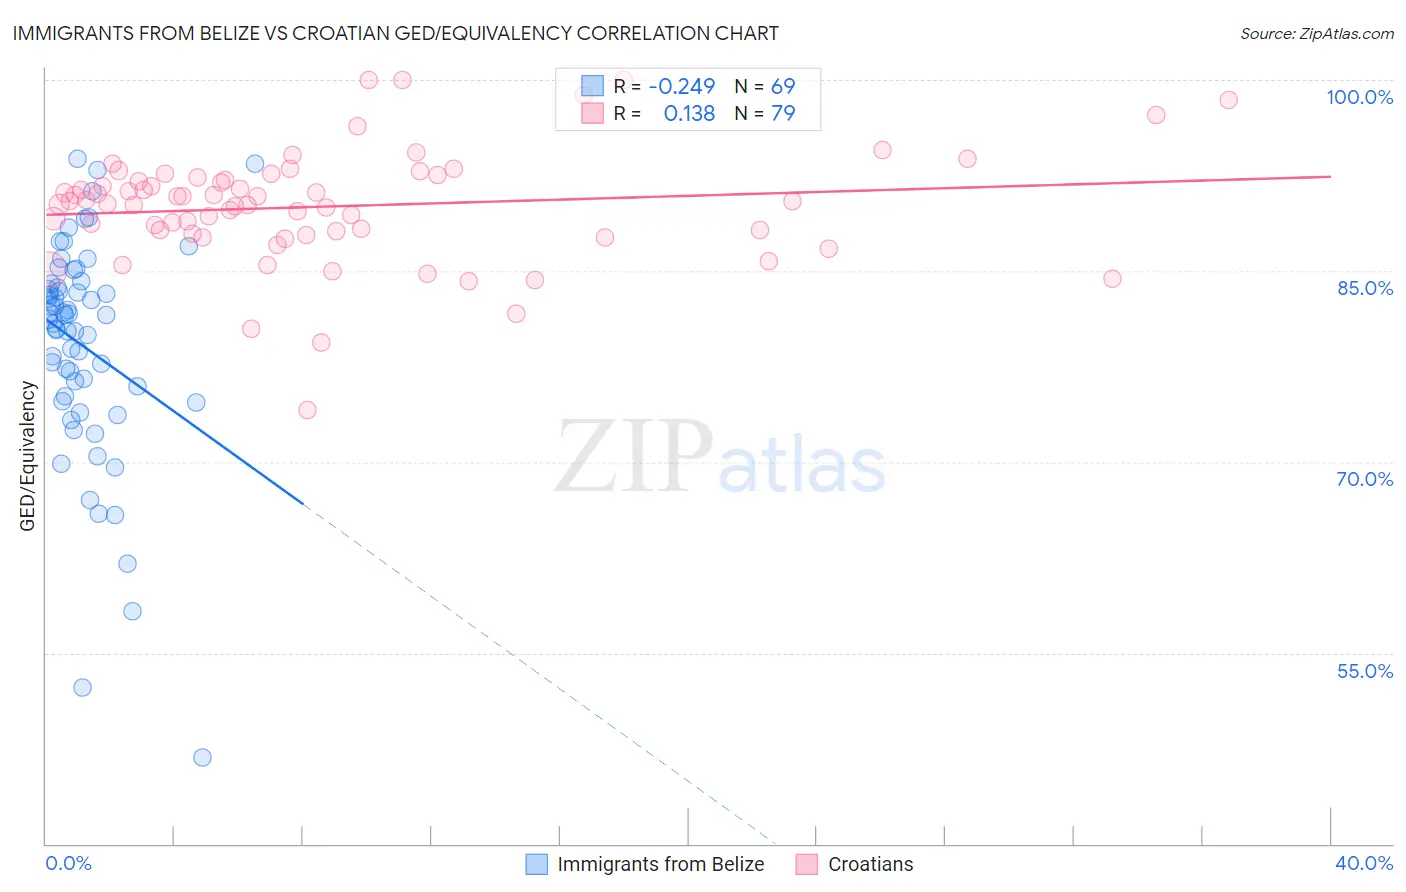
Immigrants from Belize vs Croatian GED/Equivalency Correlation Chart
The statistical analysis conducted on geographies consisting of 130,250,151 people shows a weak negative correlation between the proportion of Immigrants from Belize and percentage of population with at least ged/equivalency education in the United States with a correlation coefficient (R) of -0.249 and weighted average of 80.5%. Similarly, the statistical analysis conducted on geographies consisting of 375,732,690 people shows a poor positive correlation between the proportion of Croatians and percentage of population with at least ged/equivalency education in the United States with a correlation coefficient (R) of 0.138 and weighted average of 88.8%, a difference of 10.4%.
GED/Equivalency Correlation Summary
| Measurement | Immigrants from Belize | Croatian |
| Minimum | 46.8% | 74.1% |
| Maximum | 93.8% | 100.0% |
| Range | 47.0% | 25.9% |
| Mean | 79.0% | 90.1% |
| Median | 81.2% | 90.5% |
| Interquartile 25% (IQ1) | 75.0% | 87.9% |
| Interquartile 75% (IQ3) | 83.8% | 92.3% |
| Interquartile Range (IQR) | 8.9% | 4.4% |
| Standard Deviation (Sample) | 8.8% | 4.5% |
| Standard Deviation (Population) | 8.7% | 4.4% |
Similar Demographics by GED/Equivalency
Demographics Similar to Immigrants from Belize by GED/Equivalency
In terms of ged/equivalency, the demographic groups most similar to Immigrants from Belize are Yaqui (80.5%, a difference of 0.0%), Immigrants from Caribbean (80.5%, a difference of 0.020%), Central American Indian (80.6%, a difference of 0.13%), Apache (80.7%, a difference of 0.26%), and Immigrants from Cuba (80.2%, a difference of 0.41%).
| Demographics | Rating | Rank | GED/Equivalency |
| Nicaraguans | 0.0 /100 | #312 | Tragic 80.9% |
| Cape Verdeans | 0.0 /100 | #313 | Tragic 80.9% |
| Belizeans | 0.0 /100 | #314 | Tragic 80.9% |
| Apache | 0.0 /100 | #315 | Tragic 80.7% |
| Central American Indians | 0.0 /100 | #316 | Tragic 80.6% |
| Immigrants | Caribbean | 0.0 /100 | #317 | Tragic 80.5% |
| Yaqui | 0.0 /100 | #318 | Tragic 80.5% |
| Immigrants | Belize | 0.0 /100 | #319 | Tragic 80.5% |
| Immigrants | Cuba | 0.0 /100 | #320 | Tragic 80.2% |
| Yup'ik | 0.0 /100 | #321 | Tragic 80.0% |
| Lumbee | 0.0 /100 | #322 | Tragic 80.0% |
| Immigrants | Nicaragua | 0.0 /100 | #323 | Tragic 79.9% |
| Mexican American Indians | 0.0 /100 | #324 | Tragic 79.4% |
| Hondurans | 0.0 /100 | #325 | Tragic 79.3% |
| Yuman | 0.0 /100 | #326 | Tragic 79.2% |
Demographics Similar to Croatians by GED/Equivalency
In terms of ged/equivalency, the demographic groups most similar to Croatians are Immigrants from Taiwan (88.8%, a difference of 0.030%), Slovene (88.8%, a difference of 0.030%), Okinawan (88.9%, a difference of 0.060%), Cypriot (88.9%, a difference of 0.080%), and Swedish (88.8%, a difference of 0.080%).
| Demographics | Rating | Rank | GED/Equivalency |
| Norwegians | 99.9 /100 | #10 | Exceptional 89.0% |
| Bulgarians | 99.9 /100 | #11 | Exceptional 89.0% |
| Lithuanians | 99.9 /100 | #12 | Exceptional 88.9% |
| Immigrants | Iran | 99.9 /100 | #13 | Exceptional 88.9% |
| Cypriots | 99.9 /100 | #14 | Exceptional 88.9% |
| Okinawans | 99.9 /100 | #15 | Exceptional 88.9% |
| Immigrants | Taiwan | 99.9 /100 | #16 | Exceptional 88.8% |
| Croatians | 99.9 /100 | #17 | Exceptional 88.8% |
| Slovenes | 99.9 /100 | #18 | Exceptional 88.8% |
| Swedes | 99.9 /100 | #19 | Exceptional 88.8% |
| Maltese | 99.9 /100 | #20 | Exceptional 88.6% |
| Luxembourgers | 99.8 /100 | #21 | Exceptional 88.6% |
| Immigrants | Ireland | 99.8 /100 | #22 | Exceptional 88.6% |
| Russians | 99.8 /100 | #23 | Exceptional 88.6% |
| Slovaks | 99.8 /100 | #24 | Exceptional 88.6% |