Immigrants from Ecuador vs Potawatomi College, Under 1 year
COMPARE
Immigrants from Ecuador
Potawatomi
College, Under 1 year
College, Under 1 year Comparison
Immigrants from Ecuador
Potawatomi
58.7%
COLLEGE, UNDER 1 YEAR
0.0/ 100
METRIC RATING
298th/ 347
METRIC RANK
61.8%
COLLEGE, UNDER 1 YEAR
0.6/ 100
METRIC RATING
248th/ 347
METRIC RANK
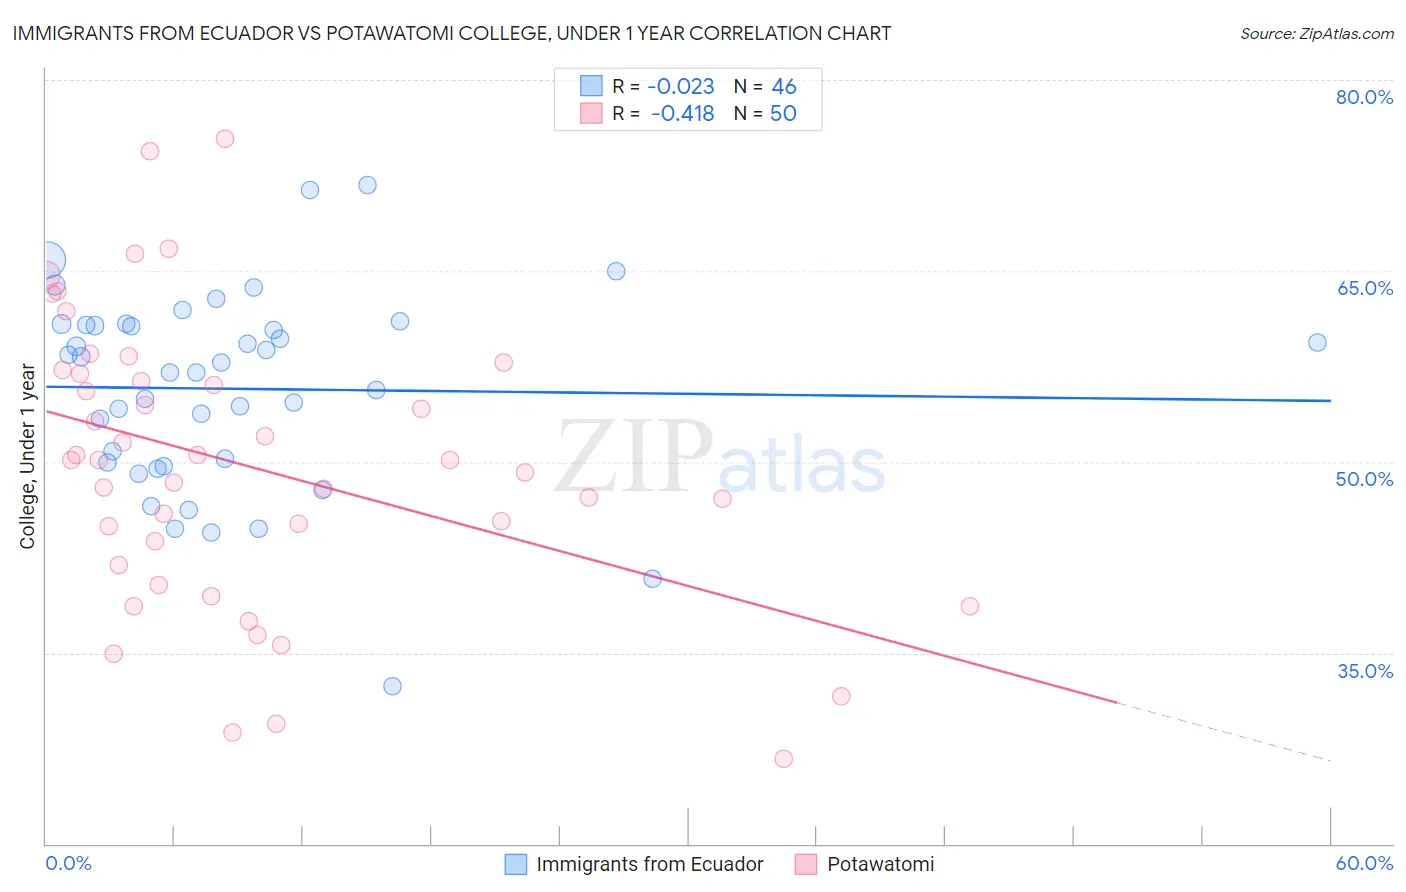
Immigrants from Ecuador vs Potawatomi College, Under 1 year Correlation Chart
The statistical analysis conducted on geographies consisting of 270,962,752 people shows no correlation between the proportion of Immigrants from Ecuador and percentage of population with at least college, under 1 year education in the United States with a correlation coefficient (R) of -0.023 and weighted average of 58.7%. Similarly, the statistical analysis conducted on geographies consisting of 117,773,444 people shows a moderate negative correlation between the proportion of Potawatomi and percentage of population with at least college, under 1 year education in the United States with a correlation coefficient (R) of -0.418 and weighted average of 61.8%, a difference of 5.2%.
College, Under 1 year Correlation Summary
| Measurement | Immigrants from Ecuador | Potawatomi |
| Minimum | 32.4% | 26.7% |
| Maximum | 71.7% | 75.4% |
| Range | 39.3% | 48.7% |
| Mean | 55.7% | 49.6% |
| Median | 57.5% | 50.1% |
| Interquartile 25% (IQ1) | 49.9% | 41.9% |
| Interquartile 75% (IQ3) | 60.7% | 56.9% |
| Interquartile Range (IQR) | 10.8% | 15.0% |
| Standard Deviation (Sample) | 7.8% | 11.2% |
| Standard Deviation (Population) | 7.7% | 11.1% |
Similar Demographics by College, Under 1 year
Demographics Similar to Immigrants from Ecuador by College, Under 1 year
In terms of college, under 1 year, the demographic groups most similar to Immigrants from Ecuador are Cuban (58.6%, a difference of 0.13%), Immigrants from Guyana (58.5%, a difference of 0.39%), Guyanese (59.0%, a difference of 0.50%), Central American Indian (59.0%, a difference of 0.55%), and Immigrants from Grenada (59.1%, a difference of 0.59%).
| Demographics | Rating | Rank | College, Under 1 year |
| Creek | 0.0 /100 | #291 | Tragic 59.3% |
| Nicaraguans | 0.0 /100 | #292 | Tragic 59.2% |
| Seminole | 0.0 /100 | #293 | Tragic 59.1% |
| Immigrants | Belize | 0.0 /100 | #294 | Tragic 59.1% |
| Immigrants | Grenada | 0.0 /100 | #295 | Tragic 59.1% |
| Central American Indians | 0.0 /100 | #296 | Tragic 59.0% |
| Guyanese | 0.0 /100 | #297 | Tragic 59.0% |
| Immigrants | Ecuador | 0.0 /100 | #298 | Tragic 58.7% |
| Cubans | 0.0 /100 | #299 | Tragic 58.6% |
| Immigrants | Guyana | 0.0 /100 | #300 | Tragic 58.5% |
| Mexican American Indians | 0.0 /100 | #301 | Tragic 58.1% |
| Apache | 0.0 /100 | #302 | Tragic 58.0% |
| Immigrants | Dominica | 0.0 /100 | #303 | Tragic 57.9% |
| Kiowa | 0.0 /100 | #304 | Tragic 57.8% |
| Haitians | 0.0 /100 | #305 | Tragic 57.8% |
Demographics Similar to Potawatomi by College, Under 1 year
In terms of college, under 1 year, the demographic groups most similar to Potawatomi are Vietnamese (61.7%, a difference of 0.16%), Immigrants from Congo (61.7%, a difference of 0.16%), Immigrants from Liberia (61.9%, a difference of 0.23%), Marshallese (61.9%, a difference of 0.26%), and Immigrants from Micronesia (61.5%, a difference of 0.35%).
| Demographics | Rating | Rank | College, Under 1 year |
| Ottawa | 1.1 /100 | #241 | Tragic 62.2% |
| Malaysians | 1.1 /100 | #242 | Tragic 62.2% |
| Hawaiians | 1.1 /100 | #243 | Tragic 62.1% |
| Colville | 1.0 /100 | #244 | Tragic 62.1% |
| Delaware | 0.9 /100 | #245 | Tragic 62.1% |
| Marshallese | 0.8 /100 | #246 | Tragic 61.9% |
| Immigrants | Liberia | 0.8 /100 | #247 | Tragic 61.9% |
| Potawatomi | 0.6 /100 | #248 | Tragic 61.8% |
| Vietnamese | 0.5 /100 | #249 | Tragic 61.7% |
| Immigrants | Congo | 0.5 /100 | #250 | Tragic 61.7% |
| Immigrants | Micronesia | 0.5 /100 | #251 | Tragic 61.5% |
| West Indians | 0.4 /100 | #252 | Tragic 61.5% |
| Japanese | 0.4 /100 | #253 | Tragic 61.5% |
| Immigrants | Cambodia | 0.4 /100 | #254 | Tragic 61.5% |
| Comanche | 0.4 /100 | #255 | Tragic 61.4% |