Macedonian vs Potawatomi Cognitive Disability
COMPARE
Macedonian
Potawatomi
Cognitive Disability
Cognitive Disability Comparison
Macedonians
Potawatomi
16.5%
COGNITIVE DISABILITY
99.8/ 100
METRIC RATING
44th/ 347
METRIC RANK
18.0%
COGNITIVE DISABILITY
0.2/ 100
METRIC RATING
271st/ 347
METRIC RANK
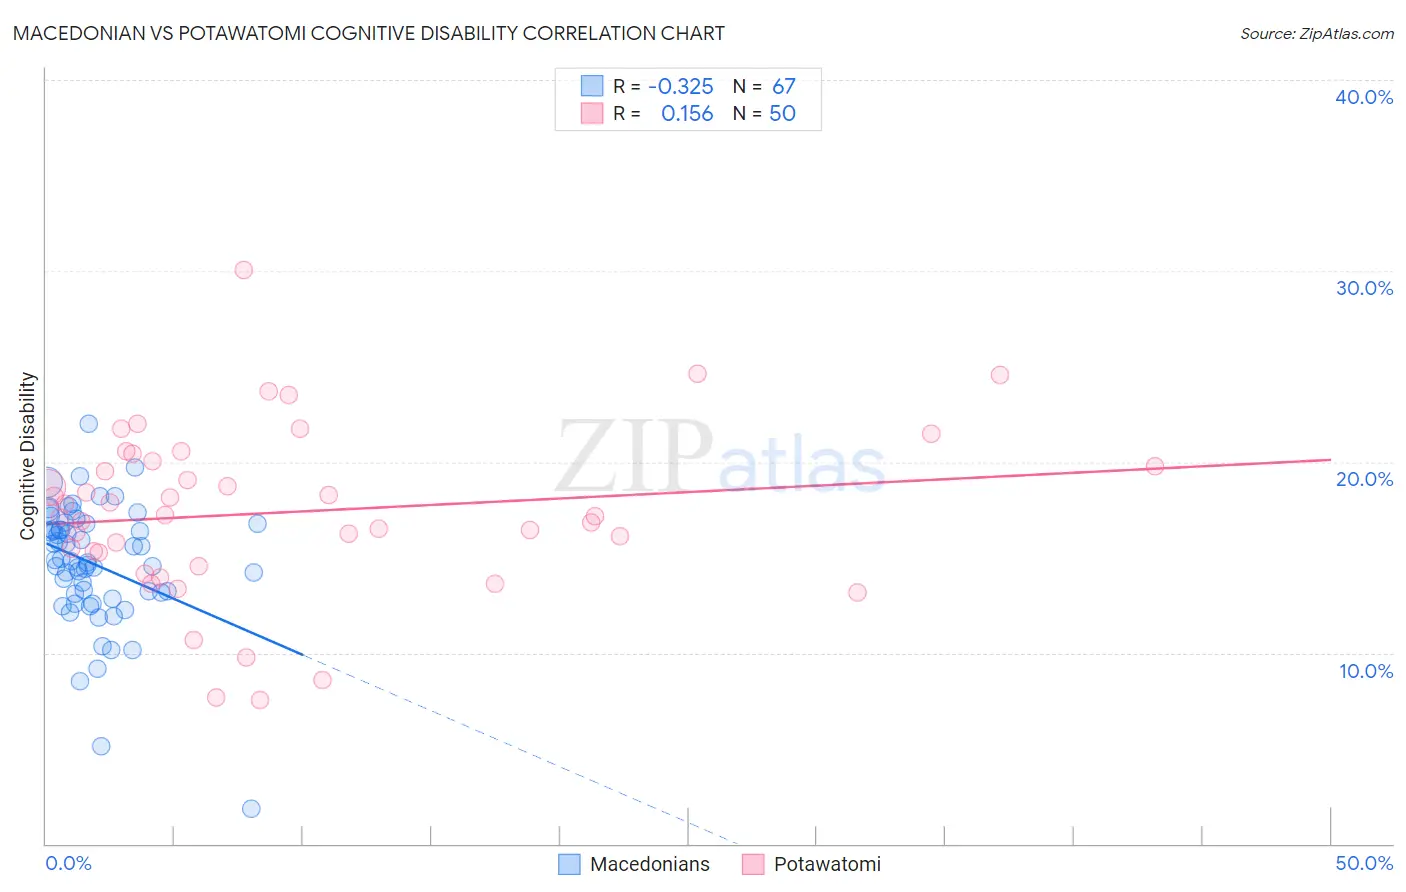
Macedonian vs Potawatomi Cognitive Disability Correlation Chart
The statistical analysis conducted on geographies consisting of 132,658,895 people shows a mild negative correlation between the proportion of Macedonians and percentage of population with cognitive disability in the United States with a correlation coefficient (R) of -0.325 and weighted average of 16.5%. Similarly, the statistical analysis conducted on geographies consisting of 117,767,379 people shows a poor positive correlation between the proportion of Potawatomi and percentage of population with cognitive disability in the United States with a correlation coefficient (R) of 0.156 and weighted average of 18.0%, a difference of 9.3%.
Cognitive Disability Correlation Summary
| Measurement | Macedonian | Potawatomi |
| Minimum | 1.8% | 7.5% |
| Maximum | 22.0% | 30.0% |
| Range | 20.2% | 22.5% |
| Mean | 14.6% | 17.4% |
| Median | 14.8% | 17.2% |
| Interquartile 25% (IQ1) | 13.1% | 15.2% |
| Interquartile 75% (IQ3) | 16.8% | 20.0% |
| Interquartile Range (IQR) | 3.7% | 4.8% |
| Standard Deviation (Sample) | 3.2% | 4.4% |
| Standard Deviation (Population) | 3.2% | 4.4% |
Similar Demographics by Cognitive Disability
Demographics Similar to Macedonians by Cognitive Disability
In terms of cognitive disability, the demographic groups most similar to Macedonians are Immigrants from Europe (16.5%, a difference of 0.010%), Immigrants from Colombia (16.5%, a difference of 0.020%), Immigrants from Canada (16.5%, a difference of 0.030%), Immigrants from Italy (16.5%, a difference of 0.050%), and Immigrants from North America (16.5%, a difference of 0.050%).
| Demographics | Rating | Rank | Cognitive Disability |
| Slovenes | 99.9 /100 | #37 | Exceptional 16.5% |
| Immigrants | Eastern Europe | 99.9 /100 | #38 | Exceptional 16.5% |
| Bolivians | 99.9 /100 | #39 | Exceptional 16.5% |
| Immigrants | Belarus | 99.9 /100 | #40 | Exceptional 16.5% |
| Cubans | 99.9 /100 | #41 | Exceptional 16.5% |
| Hungarians | 99.9 /100 | #42 | Exceptional 16.5% |
| Immigrants | Canada | 99.8 /100 | #43 | Exceptional 16.5% |
| Macedonians | 99.8 /100 | #44 | Exceptional 16.5% |
| Immigrants | Europe | 99.8 /100 | #45 | Exceptional 16.5% |
| Immigrants | Colombia | 99.8 /100 | #46 | Exceptional 16.5% |
| Immigrants | Italy | 99.8 /100 | #47 | Exceptional 16.5% |
| Immigrants | North America | 99.8 /100 | #48 | Exceptional 16.5% |
| Iranians | 99.8 /100 | #49 | Exceptional 16.5% |
| Norwegians | 99.8 /100 | #50 | Exceptional 16.5% |
| Immigrants | Korea | 99.8 /100 | #51 | Exceptional 16.5% |
Demographics Similar to Potawatomi by Cognitive Disability
In terms of cognitive disability, the demographic groups most similar to Potawatomi are Immigrants from Honduras (18.0%, a difference of 0.010%), Immigrants from Bahamas (18.0%, a difference of 0.070%), Honduran (18.0%, a difference of 0.080%), Immigrants from Nepal (18.0%, a difference of 0.13%), and Immigrants from Nigeria (18.0%, a difference of 0.14%).
| Demographics | Rating | Rank | Cognitive Disability |
| Menominee | 0.4 /100 | #264 | Tragic 18.0% |
| Spanish Americans | 0.4 /100 | #265 | Tragic 18.0% |
| Belizeans | 0.4 /100 | #266 | Tragic 18.0% |
| Nepalese | 0.3 /100 | #267 | Tragic 18.0% |
| Cherokee | 0.3 /100 | #268 | Tragic 18.0% |
| Hondurans | 0.3 /100 | #269 | Tragic 18.0% |
| Immigrants | Bahamas | 0.3 /100 | #270 | Tragic 18.0% |
| Potawatomi | 0.2 /100 | #271 | Tragic 18.0% |
| Immigrants | Honduras | 0.2 /100 | #272 | Tragic 18.0% |
| Immigrants | Nepal | 0.2 /100 | #273 | Tragic 18.0% |
| Immigrants | Nigeria | 0.2 /100 | #274 | Tragic 18.0% |
| Immigrants | Laos | 0.2 /100 | #275 | Tragic 18.1% |
| Yuman | 0.2 /100 | #276 | Tragic 18.1% |
| Immigrants | Kuwait | 0.2 /100 | #277 | Tragic 18.1% |
| Immigrants | Micronesia | 0.2 /100 | #278 | Tragic 18.1% |