Nonimmigrants vs Potawatomi College, Under 1 year
COMPARE
Nonimmigrants
Potawatomi
College, Under 1 year
College, Under 1 year Comparison
Nonimmigrants
Potawatomi
62.9%
COLLEGE, UNDER 1 YEAR
3.0/ 100
METRIC RATING
230th/ 347
METRIC RANK
61.8%
COLLEGE, UNDER 1 YEAR
0.6/ 100
METRIC RATING
248th/ 347
METRIC RANK
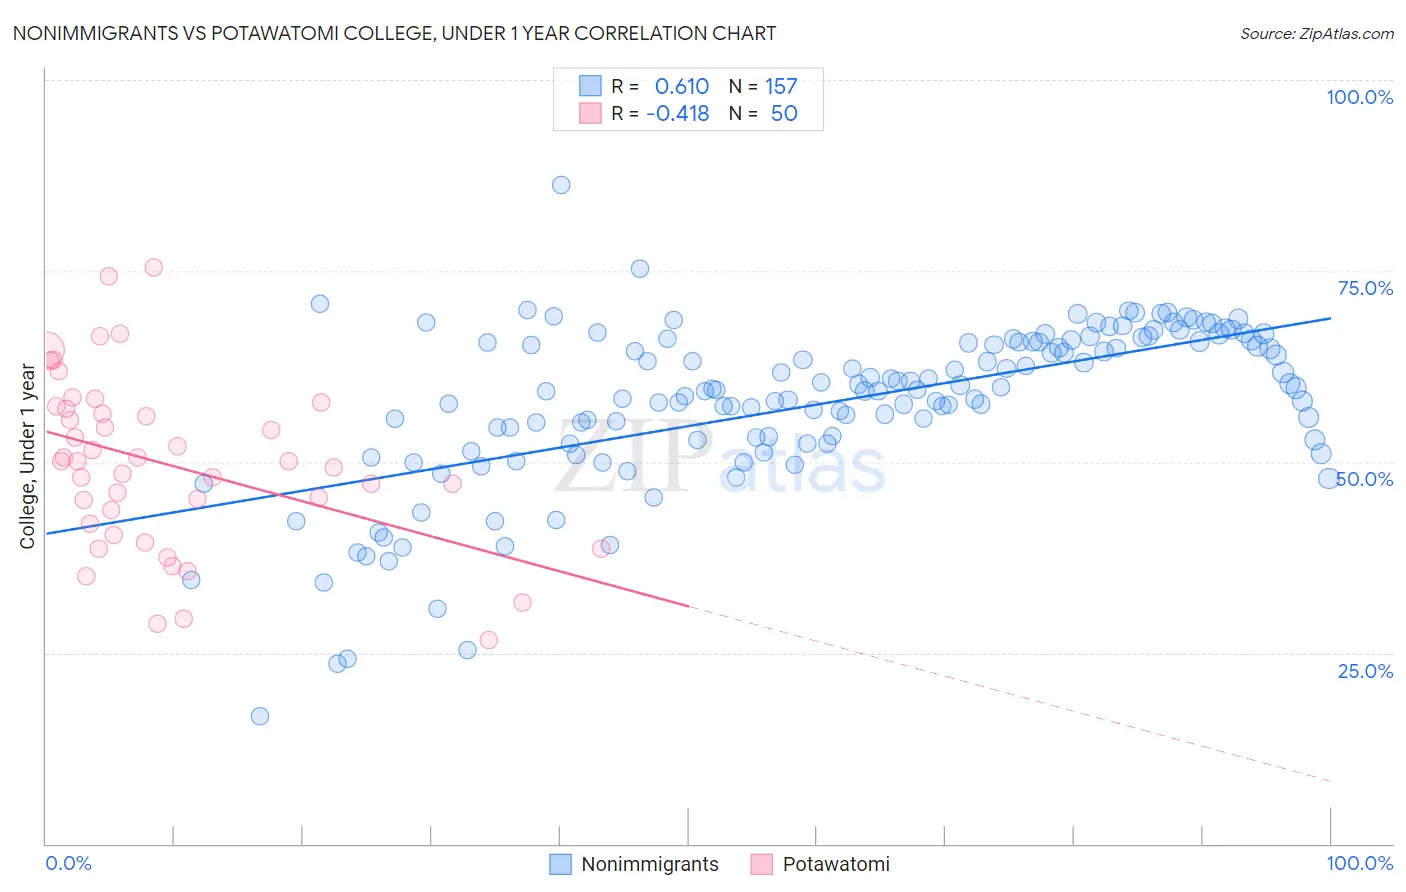
Nonimmigrants vs Potawatomi College, Under 1 year Correlation Chart
The statistical analysis conducted on geographies consisting of 585,317,870 people shows a significant positive correlation between the proportion of Nonimmigrants and percentage of population with at least college, under 1 year education in the United States with a correlation coefficient (R) of 0.610 and weighted average of 62.9%. Similarly, the statistical analysis conducted on geographies consisting of 117,773,444 people shows a moderate negative correlation between the proportion of Potawatomi and percentage of population with at least college, under 1 year education in the United States with a correlation coefficient (R) of -0.418 and weighted average of 61.8%, a difference of 1.9%.
College, Under 1 year Correlation Summary
| Measurement | Nonimmigrants | Potawatomi |
| Minimum | 16.7% | 26.7% |
| Maximum | 86.3% | 75.4% |
| Range | 69.6% | 48.7% |
| Mean | 57.6% | 49.6% |
| Median | 59.4% | 50.1% |
| Interquartile 25% (IQ1) | 52.7% | 41.9% |
| Interquartile 75% (IQ3) | 65.7% | 56.9% |
| Interquartile Range (IQR) | 13.0% | 15.0% |
| Standard Deviation (Sample) | 10.8% | 11.2% |
| Standard Deviation (Population) | 10.8% | 11.1% |
Demographics Similar to Nonimmigrants and Potawatomi by College, Under 1 year
In terms of college, under 1 year, the demographic groups most similar to Nonimmigrants are Liberian (63.0%, a difference of 0.070%), Immigrants from Western Africa (62.8%, a difference of 0.24%), Osage (62.7%, a difference of 0.34%), Iroquois (62.6%, a difference of 0.46%), and Chippewa (62.6%, a difference of 0.49%). Similarly, the demographic groups most similar to Potawatomi are Vietnamese (61.7%, a difference of 0.16%), Immigrants from Liberia (61.9%, a difference of 0.23%), Marshallese (61.9%, a difference of 0.26%), Delaware (62.1%, a difference of 0.48%), and Colville (62.1%, a difference of 0.54%).
| Demographics | Rating | Rank | College, Under 1 year |
| Liberians | 3.2 /100 | #229 | Tragic 63.0% |
| Immigrants | Nonimmigrants | 3.0 /100 | #230 | Tragic 62.9% |
| Immigrants | Western Africa | 2.4 /100 | #231 | Tragic 62.8% |
| Osage | 2.2 /100 | #232 | Tragic 62.7% |
| Iroquois | 2.0 /100 | #233 | Tragic 62.6% |
| Chippewa | 2.0 /100 | #234 | Tragic 62.6% |
| Spanish Americans | 1.9 /100 | #235 | Tragic 62.6% |
| Immigrants | Immigrants | 1.7 /100 | #236 | Tragic 62.5% |
| Immigrants | Burma/Myanmar | 1.6 /100 | #237 | Tragic 62.5% |
| French American Indians | 1.5 /100 | #238 | Tragic 62.4% |
| Nepalese | 1.1 /100 | #239 | Tragic 62.2% |
| Aleuts | 1.1 /100 | #240 | Tragic 62.2% |
| Ottawa | 1.1 /100 | #241 | Tragic 62.2% |
| Malaysians | 1.1 /100 | #242 | Tragic 62.2% |
| Hawaiians | 1.1 /100 | #243 | Tragic 62.1% |
| Colville | 1.0 /100 | #244 | Tragic 62.1% |
| Delaware | 0.9 /100 | #245 | Tragic 62.1% |
| Marshallese | 0.8 /100 | #246 | Tragic 61.9% |
| Immigrants | Liberia | 0.8 /100 | #247 | Tragic 61.9% |
| Potawatomi | 0.6 /100 | #248 | Tragic 61.8% |
| Vietnamese | 0.5 /100 | #249 | Tragic 61.7% |