Immigrants from Netherlands vs Potawatomi College, Under 1 year
COMPARE
Immigrants from Netherlands
Potawatomi
College, Under 1 year
College, Under 1 year Comparison
Immigrants from Netherlands
Potawatomi
70.0%
COLLEGE, UNDER 1 YEAR
99.8/ 100
METRIC RATING
48th/ 347
METRIC RANK
61.8%
COLLEGE, UNDER 1 YEAR
0.6/ 100
METRIC RATING
248th/ 347
METRIC RANK
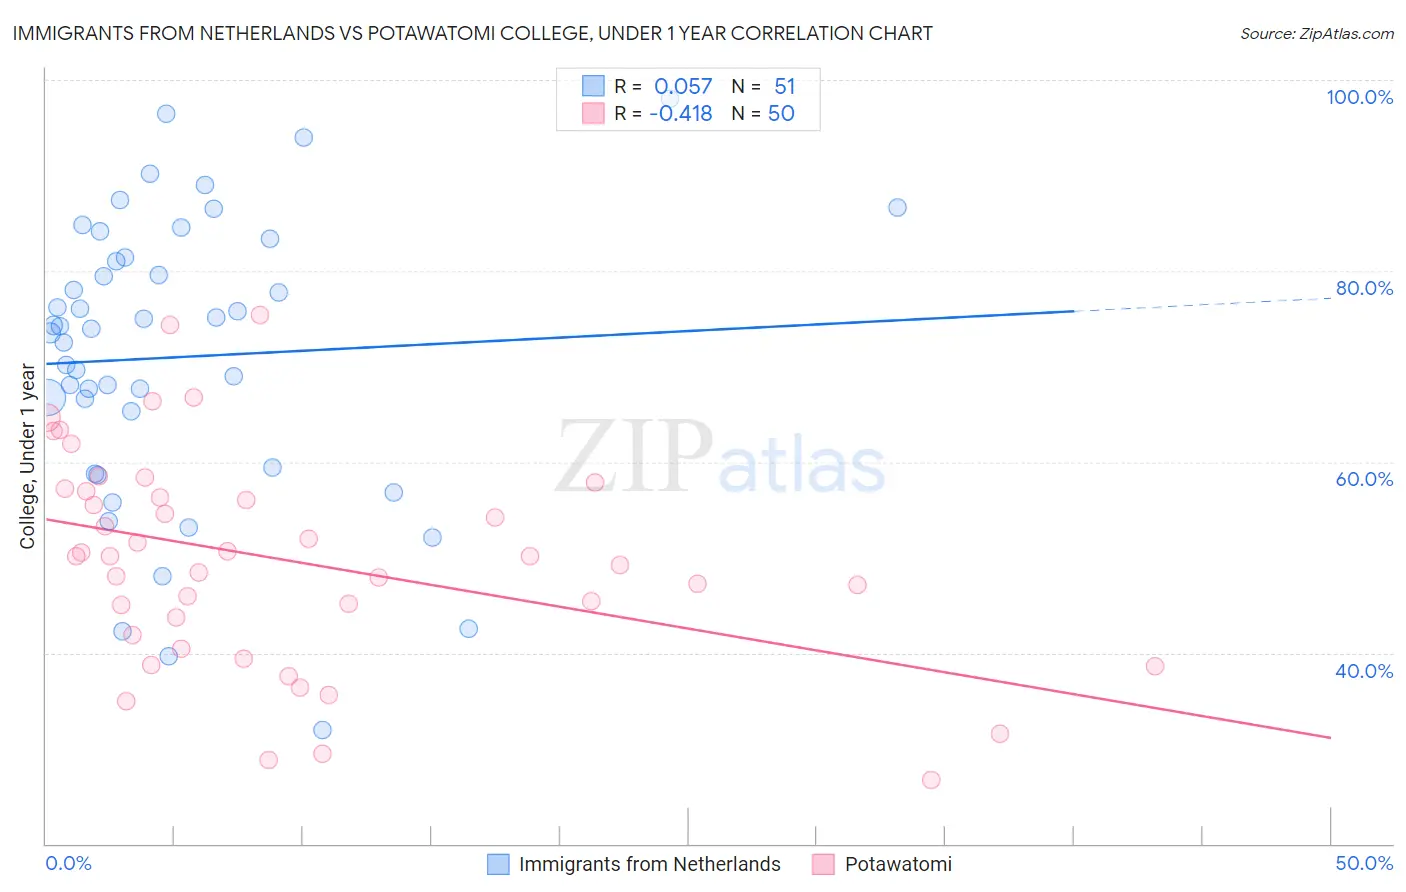
Immigrants from Netherlands vs Potawatomi College, Under 1 year Correlation Chart
The statistical analysis conducted on geographies consisting of 237,877,405 people shows a slight positive correlation between the proportion of Immigrants from Netherlands and percentage of population with at least college, under 1 year education in the United States with a correlation coefficient (R) of 0.057 and weighted average of 70.0%. Similarly, the statistical analysis conducted on geographies consisting of 117,773,444 people shows a moderate negative correlation between the proportion of Potawatomi and percentage of population with at least college, under 1 year education in the United States with a correlation coefficient (R) of -0.418 and weighted average of 61.8%, a difference of 13.4%.
College, Under 1 year Correlation Summary
| Measurement | Immigrants from Netherlands | Potawatomi |
| Minimum | 32.0% | 26.7% |
| Maximum | 98.1% | 75.4% |
| Range | 66.1% | 48.7% |
| Mean | 71.0% | 49.6% |
| Median | 73.9% | 50.1% |
| Interquartile 25% (IQ1) | 59.4% | 41.9% |
| Interquartile 75% (IQ3) | 81.4% | 56.9% |
| Interquartile Range (IQR) | 22.0% | 15.0% |
| Standard Deviation (Sample) | 15.0% | 11.2% |
| Standard Deviation (Population) | 14.9% | 11.1% |
Similar Demographics by College, Under 1 year
Demographics Similar to Immigrants from Netherlands by College, Under 1 year
In terms of college, under 1 year, the demographic groups most similar to Immigrants from Netherlands are Immigrants from Austria (70.0%, a difference of 0.040%), Immigrants from Bulgaria (70.0%, a difference of 0.060%), Zimbabwean (69.9%, a difference of 0.16%), Immigrants from Latvia (70.1%, a difference of 0.17%), and Mongolian (69.9%, a difference of 0.20%).
| Demographics | Rating | Rank | College, Under 1 year |
| Immigrants | Kuwait | 99.9 /100 | #41 | Exceptional 70.3% |
| Immigrants | Lithuania | 99.9 /100 | #42 | Exceptional 70.3% |
| Israelis | 99.9 /100 | #43 | Exceptional 70.2% |
| New Zealanders | 99.9 /100 | #44 | Exceptional 70.2% |
| Immigrants | Norway | 99.9 /100 | #45 | Exceptional 70.2% |
| Immigrants | Latvia | 99.9 /100 | #46 | Exceptional 70.1% |
| Immigrants | Bulgaria | 99.8 /100 | #47 | Exceptional 70.0% |
| Immigrants | Netherlands | 99.8 /100 | #48 | Exceptional 70.0% |
| Immigrants | Austria | 99.8 /100 | #49 | Exceptional 70.0% |
| Zimbabweans | 99.8 /100 | #50 | Exceptional 69.9% |
| Mongolians | 99.8 /100 | #51 | Exceptional 69.9% |
| Immigrants | Russia | 99.8 /100 | #52 | Exceptional 69.9% |
| South Africans | 99.7 /100 | #53 | Exceptional 69.7% |
| Immigrants | Czechoslovakia | 99.7 /100 | #54 | Exceptional 69.6% |
| Maltese | 99.7 /100 | #55 | Exceptional 69.5% |
Demographics Similar to Potawatomi by College, Under 1 year
In terms of college, under 1 year, the demographic groups most similar to Potawatomi are Vietnamese (61.7%, a difference of 0.16%), Immigrants from Congo (61.7%, a difference of 0.16%), Immigrants from Liberia (61.9%, a difference of 0.23%), Marshallese (61.9%, a difference of 0.26%), and Immigrants from Micronesia (61.5%, a difference of 0.35%).
| Demographics | Rating | Rank | College, Under 1 year |
| Ottawa | 1.1 /100 | #241 | Tragic 62.2% |
| Malaysians | 1.1 /100 | #242 | Tragic 62.2% |
| Hawaiians | 1.1 /100 | #243 | Tragic 62.1% |
| Colville | 1.0 /100 | #244 | Tragic 62.1% |
| Delaware | 0.9 /100 | #245 | Tragic 62.1% |
| Marshallese | 0.8 /100 | #246 | Tragic 61.9% |
| Immigrants | Liberia | 0.8 /100 | #247 | Tragic 61.9% |
| Potawatomi | 0.6 /100 | #248 | Tragic 61.8% |
| Vietnamese | 0.5 /100 | #249 | Tragic 61.7% |
| Immigrants | Congo | 0.5 /100 | #250 | Tragic 61.7% |
| Immigrants | Micronesia | 0.5 /100 | #251 | Tragic 61.5% |
| West Indians | 0.4 /100 | #252 | Tragic 61.5% |
| Japanese | 0.4 /100 | #253 | Tragic 61.5% |
| Immigrants | Cambodia | 0.4 /100 | #254 | Tragic 61.5% |
| Comanche | 0.4 /100 | #255 | Tragic 61.4% |