Immigrants from South Africa vs Potawatomi College, Under 1 year
COMPARE
Immigrants from South Africa
Potawatomi
College, Under 1 year
College, Under 1 year Comparison
Immigrants from South Africa
Potawatomi
70.6%
COLLEGE, UNDER 1 YEAR
99.9/ 100
METRIC RATING
33rd/ 347
METRIC RANK
61.8%
COLLEGE, UNDER 1 YEAR
0.6/ 100
METRIC RATING
248th/ 347
METRIC RANK
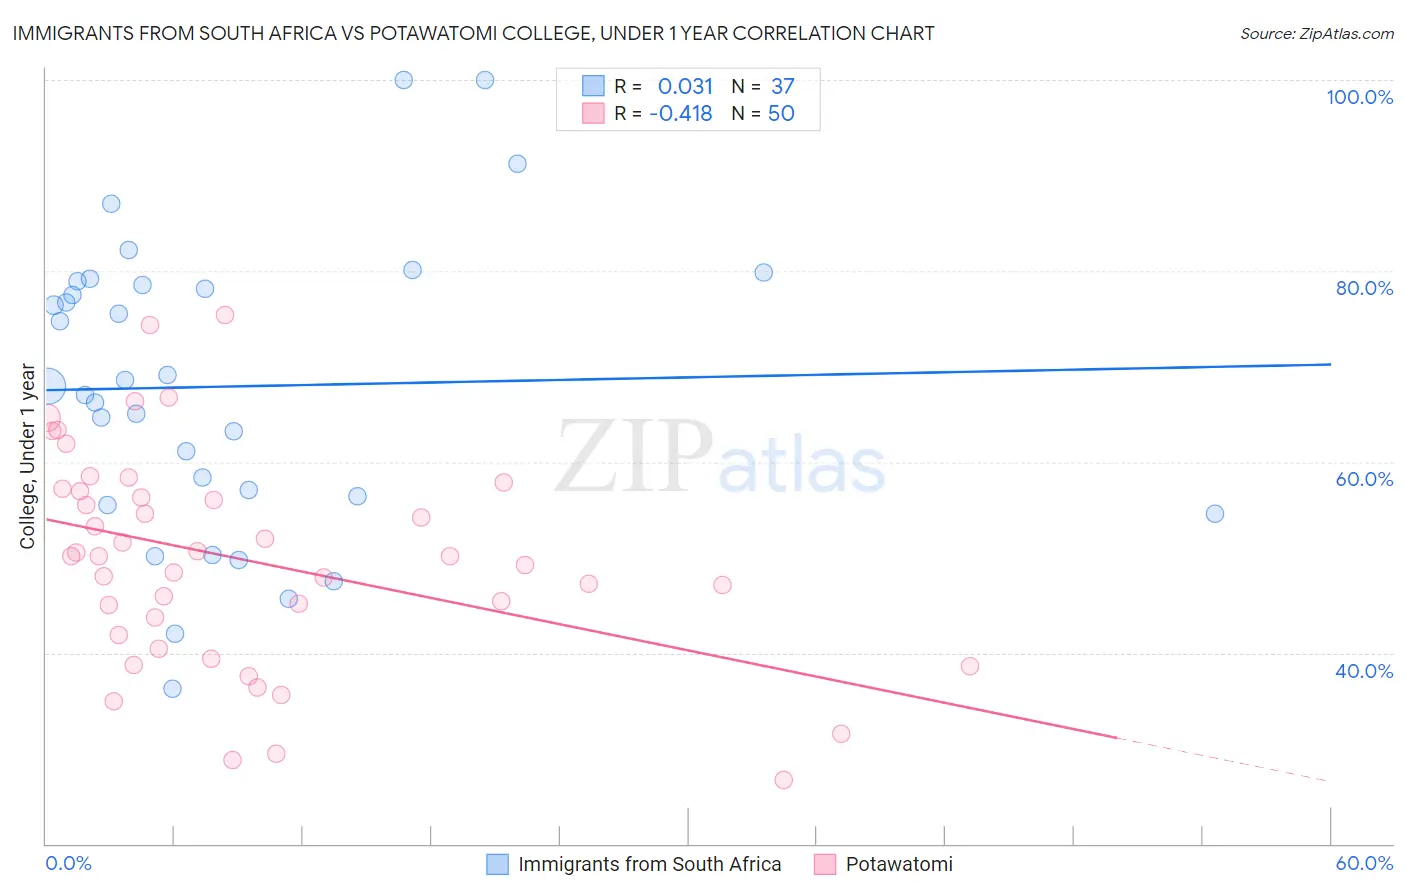
Immigrants from South Africa vs Potawatomi College, Under 1 year Correlation Chart
The statistical analysis conducted on geographies consisting of 233,321,300 people shows no correlation between the proportion of Immigrants from South Africa and percentage of population with at least college, under 1 year education in the United States with a correlation coefficient (R) of 0.031 and weighted average of 70.6%. Similarly, the statistical analysis conducted on geographies consisting of 117,773,444 people shows a moderate negative correlation between the proportion of Potawatomi and percentage of population with at least college, under 1 year education in the United States with a correlation coefficient (R) of -0.418 and weighted average of 61.8%, a difference of 14.3%.
College, Under 1 year Correlation Summary
| Measurement | Immigrants from South Africa | Potawatomi |
| Minimum | 36.2% | 26.7% |
| Maximum | 100.0% | 75.4% |
| Range | 63.8% | 48.7% |
| Mean | 67.9% | 49.6% |
| Median | 68.0% | 50.1% |
| Interquartile 25% (IQ1) | 56.0% | 41.9% |
| Interquartile 75% (IQ3) | 78.7% | 56.9% |
| Interquartile Range (IQR) | 22.8% | 15.0% |
| Standard Deviation (Sample) | 15.4% | 11.2% |
| Standard Deviation (Population) | 15.2% | 11.1% |
Similar Demographics by College, Under 1 year
Demographics Similar to Immigrants from South Africa by College, Under 1 year
In terms of college, under 1 year, the demographic groups most similar to Immigrants from South Africa are Estonian (70.6%, a difference of 0.020%), Russian (70.5%, a difference of 0.10%), Immigrants from Sri Lanka (70.5%, a difference of 0.16%), Turkish (70.7%, a difference of 0.17%), and Indian (Asian) (70.8%, a difference of 0.25%).
| Demographics | Rating | Rank | College, Under 1 year |
| Immigrants | Denmark | 100.0 /100 | #26 | Exceptional 71.0% |
| Immigrants | Ireland | 100.0 /100 | #27 | Exceptional 71.0% |
| Immigrants | Hong Kong | 100.0 /100 | #28 | Exceptional 71.0% |
| Immigrants | France | 100.0 /100 | #29 | Exceptional 71.0% |
| Immigrants | China | 99.9 /100 | #30 | Exceptional 70.9% |
| Indians (Asian) | 99.9 /100 | #31 | Exceptional 70.8% |
| Turks | 99.9 /100 | #32 | Exceptional 70.7% |
| Immigrants | South Africa | 99.9 /100 | #33 | Exceptional 70.6% |
| Estonians | 99.9 /100 | #34 | Exceptional 70.6% |
| Russians | 99.9 /100 | #35 | Exceptional 70.5% |
| Immigrants | Sri Lanka | 99.9 /100 | #36 | Exceptional 70.5% |
| Immigrants | Saudi Arabia | 99.9 /100 | #37 | Exceptional 70.4% |
| Australians | 99.9 /100 | #38 | Exceptional 70.4% |
| Bhutanese | 99.9 /100 | #39 | Exceptional 70.3% |
| Immigrants | Turkey | 99.9 /100 | #40 | Exceptional 70.3% |
Demographics Similar to Potawatomi by College, Under 1 year
In terms of college, under 1 year, the demographic groups most similar to Potawatomi are Vietnamese (61.7%, a difference of 0.16%), Immigrants from Congo (61.7%, a difference of 0.16%), Immigrants from Liberia (61.9%, a difference of 0.23%), Marshallese (61.9%, a difference of 0.26%), and Immigrants from Micronesia (61.5%, a difference of 0.35%).
| Demographics | Rating | Rank | College, Under 1 year |
| Ottawa | 1.1 /100 | #241 | Tragic 62.2% |
| Malaysians | 1.1 /100 | #242 | Tragic 62.2% |
| Hawaiians | 1.1 /100 | #243 | Tragic 62.1% |
| Colville | 1.0 /100 | #244 | Tragic 62.1% |
| Delaware | 0.9 /100 | #245 | Tragic 62.1% |
| Marshallese | 0.8 /100 | #246 | Tragic 61.9% |
| Immigrants | Liberia | 0.8 /100 | #247 | Tragic 61.9% |
| Potawatomi | 0.6 /100 | #248 | Tragic 61.8% |
| Vietnamese | 0.5 /100 | #249 | Tragic 61.7% |
| Immigrants | Congo | 0.5 /100 | #250 | Tragic 61.7% |
| Immigrants | Micronesia | 0.5 /100 | #251 | Tragic 61.5% |
| West Indians | 0.4 /100 | #252 | Tragic 61.5% |
| Japanese | 0.4 /100 | #253 | Tragic 61.5% |
| Immigrants | Cambodia | 0.4 /100 | #254 | Tragic 61.5% |
| Comanche | 0.4 /100 | #255 | Tragic 61.4% |