Serbian vs Immigrants from Taiwan GED/Equivalency
COMPARE
Serbian
Immigrants from Taiwan
GED/Equivalency
GED/Equivalency Comparison
Serbians
Immigrants from Taiwan
87.9%
GED/EQUIVALENCY
99.3/ 100
METRIC RATING
59th/ 347
METRIC RANK
88.8%
GED/EQUIVALENCY
99.9/ 100
METRIC RATING
16th/ 347
METRIC RANK
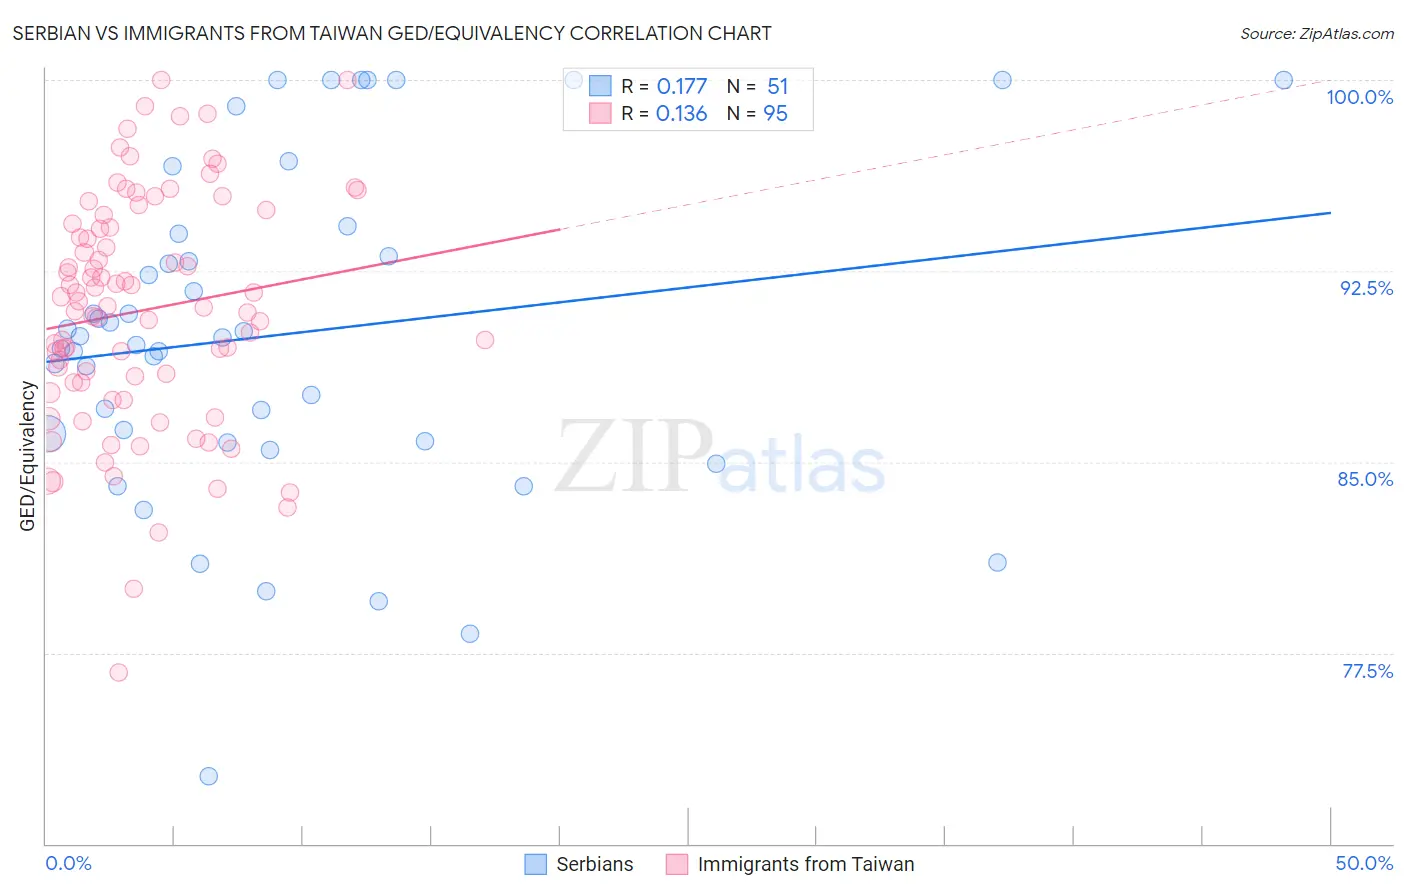
Serbian vs Immigrants from Taiwan GED/Equivalency Correlation Chart
The statistical analysis conducted on geographies consisting of 267,642,942 people shows a poor positive correlation between the proportion of Serbians and percentage of population with at least ged/equivalency education in the United States with a correlation coefficient (R) of 0.177 and weighted average of 87.9%. Similarly, the statistical analysis conducted on geographies consisting of 298,292,402 people shows a poor positive correlation between the proportion of Immigrants from Taiwan and percentage of population with at least ged/equivalency education in the United States with a correlation coefficient (R) of 0.136 and weighted average of 88.8%, a difference of 1.1%.
GED/Equivalency Correlation Summary
| Measurement | Serbian | Immigrants from Taiwan |
| Minimum | 72.6% | 76.7% |
| Maximum | 100.0% | 100.0% |
| Range | 27.4% | 23.3% |
| Mean | 90.0% | 91.0% |
| Median | 89.9% | 91.1% |
| Interquartile 25% (IQ1) | 85.8% | 88.1% |
| Interquartile 75% (IQ3) | 94.0% | 94.4% |
| Interquartile Range (IQR) | 8.2% | 6.2% |
| Standard Deviation (Sample) | 6.5% | 4.6% |
| Standard Deviation (Population) | 6.4% | 4.5% |
Similar Demographics by GED/Equivalency
Demographics Similar to Serbians by GED/Equivalency
In terms of ged/equivalency, the demographic groups most similar to Serbians are Immigrants from Czechoslovakia (87.9%, a difference of 0.010%), Northern European (87.9%, a difference of 0.010%), Scandinavian (87.9%, a difference of 0.010%), European (87.9%, a difference of 0.010%), and German (87.9%, a difference of 0.030%).
| Demographics | Rating | Rank | GED/Equivalency |
| Zimbabweans | 99.4 /100 | #52 | Exceptional 88.0% |
| Immigrants | South Africa | 99.4 /100 | #53 | Exceptional 88.0% |
| Soviet Union | 99.4 /100 | #54 | Exceptional 88.0% |
| New Zealanders | 99.4 /100 | #55 | Exceptional 88.0% |
| Immigrants | Denmark | 99.4 /100 | #56 | Exceptional 88.0% |
| Immigrants | Czechoslovakia | 99.3 /100 | #57 | Exceptional 87.9% |
| Northern Europeans | 99.3 /100 | #58 | Exceptional 87.9% |
| Serbians | 99.3 /100 | #59 | Exceptional 87.9% |
| Scandinavians | 99.3 /100 | #60 | Exceptional 87.9% |
| Europeans | 99.3 /100 | #61 | Exceptional 87.9% |
| Germans | 99.3 /100 | #62 | Exceptional 87.9% |
| Immigrants | Turkey | 99.2 /100 | #63 | Exceptional 87.9% |
| Immigrants | Canada | 99.2 /100 | #64 | Exceptional 87.9% |
| Immigrants | North America | 99.1 /100 | #65 | Exceptional 87.8% |
| Immigrants | Bulgaria | 99.1 /100 | #66 | Exceptional 87.8% |
Demographics Similar to Immigrants from Taiwan by GED/Equivalency
In terms of ged/equivalency, the demographic groups most similar to Immigrants from Taiwan are Okinawan (88.9%, a difference of 0.030%), Croatian (88.8%, a difference of 0.030%), Cypriot (88.9%, a difference of 0.050%), Slovene (88.8%, a difference of 0.060%), and Immigrants from Iran (88.9%, a difference of 0.080%).
| Demographics | Rating | Rank | GED/Equivalency |
| Chinese | 99.9 /100 | #9 | Exceptional 89.0% |
| Norwegians | 99.9 /100 | #10 | Exceptional 89.0% |
| Bulgarians | 99.9 /100 | #11 | Exceptional 89.0% |
| Lithuanians | 99.9 /100 | #12 | Exceptional 88.9% |
| Immigrants | Iran | 99.9 /100 | #13 | Exceptional 88.9% |
| Cypriots | 99.9 /100 | #14 | Exceptional 88.9% |
| Okinawans | 99.9 /100 | #15 | Exceptional 88.9% |
| Immigrants | Taiwan | 99.9 /100 | #16 | Exceptional 88.8% |
| Croatians | 99.9 /100 | #17 | Exceptional 88.8% |
| Slovenes | 99.9 /100 | #18 | Exceptional 88.8% |
| Swedes | 99.9 /100 | #19 | Exceptional 88.8% |
| Maltese | 99.9 /100 | #20 | Exceptional 88.6% |
| Luxembourgers | 99.8 /100 | #21 | Exceptional 88.6% |
| Immigrants | Ireland | 99.8 /100 | #22 | Exceptional 88.6% |
| Russians | 99.8 /100 | #23 | Exceptional 88.6% |