Japanese vs Immigrants from Dominican Republic Associate's Degree
COMPARE
Japanese
Immigrants from Dominican Republic
Associate's Degree
Associate's Degree Comparison
Japanese
Immigrants from Dominican Republic
41.7%
ASSOCIATE'S DEGREE
0.5/ 100
METRIC RATING
258th/ 347
METRIC RANK
37.9%
ASSOCIATE'S DEGREE
0.0/ 100
METRIC RATING
310th/ 347
METRIC RANK
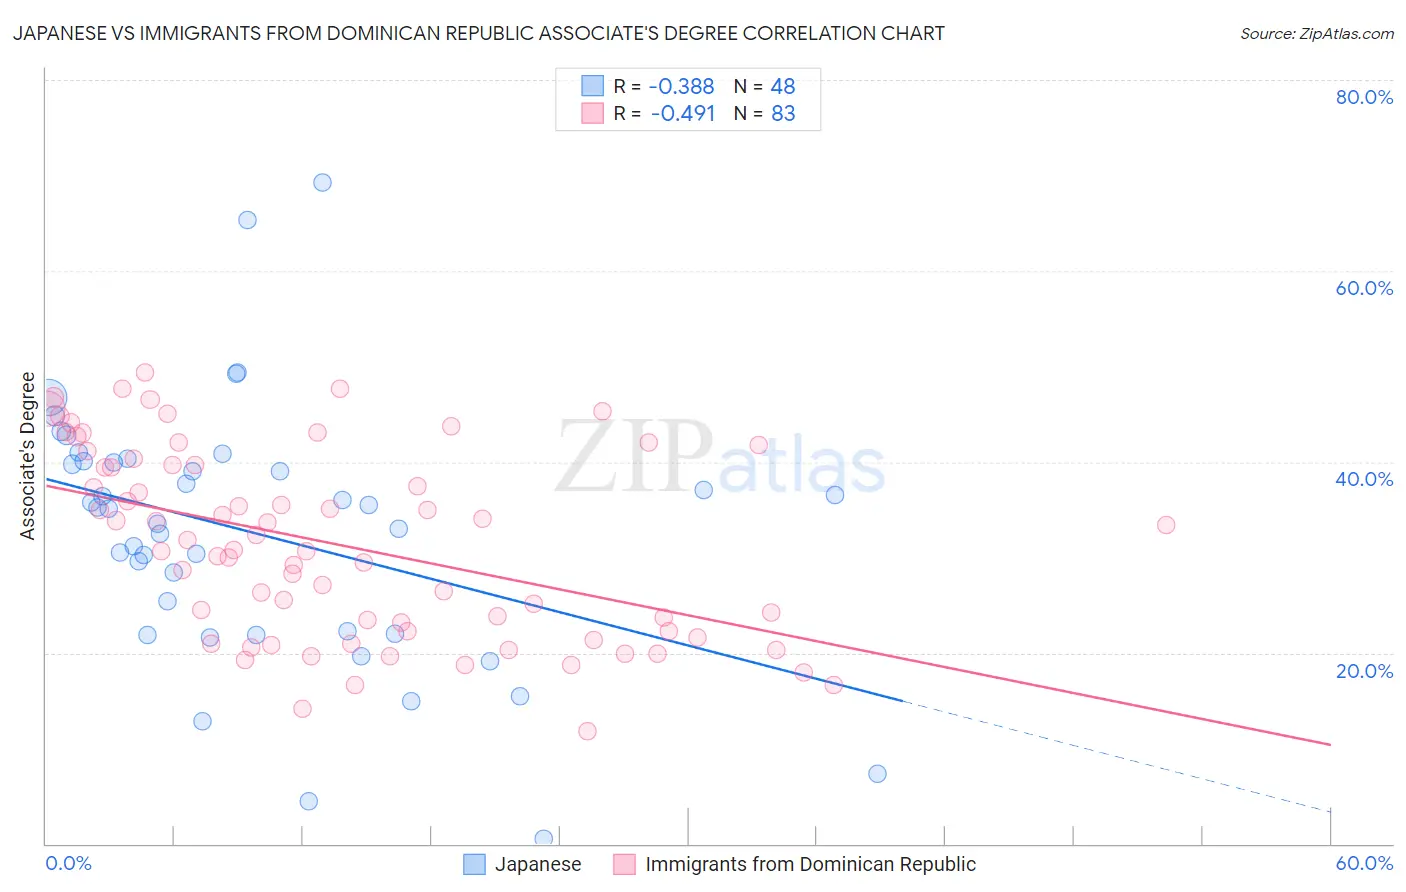
Japanese vs Immigrants from Dominican Republic Associate's Degree Correlation Chart
The statistical analysis conducted on geographies consisting of 249,174,886 people shows a mild negative correlation between the proportion of Japanese and percentage of population with at least associate's degree education in the United States with a correlation coefficient (R) of -0.388 and weighted average of 41.7%. Similarly, the statistical analysis conducted on geographies consisting of 275,132,168 people shows a moderate negative correlation between the proportion of Immigrants from Dominican Republic and percentage of population with at least associate's degree education in the United States with a correlation coefficient (R) of -0.491 and weighted average of 37.9%, a difference of 10.0%.
Associate's Degree Correlation Summary
| Measurement | Japanese | Immigrants from Dominican Republic |
| Minimum | 0.50% | 11.8% |
| Maximum | 69.2% | 49.4% |
| Range | 68.7% | 37.6% |
| Mean | 32.6% | 31.3% |
| Median | 35.1% | 30.8% |
| Interquartile 25% (IQ1) | 22.1% | 22.2% |
| Interquartile 75% (IQ3) | 40.0% | 39.7% |
| Interquartile Range (IQR) | 17.9% | 17.5% |
| Standard Deviation (Sample) | 13.5% | 9.8% |
| Standard Deviation (Population) | 13.4% | 9.7% |
Similar Demographics by Associate's Degree
Demographics Similar to Japanese by Associate's Degree
In terms of associate's degree, the demographic groups most similar to Japanese are Malaysian (41.6%, a difference of 0.10%), Spanish American (41.8%, a difference of 0.22%), Immigrants from Congo (41.8%, a difference of 0.27%), Marshallese (41.6%, a difference of 0.30%), and Immigrants from Guyana (41.8%, a difference of 0.40%).
| Demographics | Rating | Rank | Associate's Degree |
| Immigrants | Bahamas | 0.7 /100 | #251 | Tragic 42.1% |
| French American Indians | 0.6 /100 | #252 | Tragic 42.0% |
| Indonesians | 0.6 /100 | #253 | Tragic 41.9% |
| Cubans | 0.6 /100 | #254 | Tragic 41.9% |
| Immigrants | Guyana | 0.5 /100 | #255 | Tragic 41.8% |
| Immigrants | Congo | 0.5 /100 | #256 | Tragic 41.8% |
| Spanish Americans | 0.5 /100 | #257 | Tragic 41.8% |
| Japanese | 0.5 /100 | #258 | Tragic 41.7% |
| Malaysians | 0.4 /100 | #259 | Tragic 41.6% |
| Marshallese | 0.4 /100 | #260 | Tragic 41.6% |
| Nicaraguans | 0.4 /100 | #261 | Tragic 41.5% |
| Bahamians | 0.4 /100 | #262 | Tragic 41.5% |
| Immigrants | Jamaica | 0.3 /100 | #263 | Tragic 41.5% |
| Osage | 0.3 /100 | #264 | Tragic 41.5% |
| Africans | 0.2 /100 | #265 | Tragic 41.1% |
Demographics Similar to Immigrants from Dominican Republic by Associate's Degree
In terms of associate's degree, the demographic groups most similar to Immigrants from Dominican Republic are Immigrants from Latin America (37.9%, a difference of 0.11%), Choctaw (37.8%, a difference of 0.33%), Hispanic or Latino (37.7%, a difference of 0.48%), Seminole (37.7%, a difference of 0.53%), and Immigrants from Guatemala (38.1%, a difference of 0.62%).
| Demographics | Rating | Rank | Associate's Degree |
| Guatemalans | 0.0 /100 | #303 | Tragic 38.5% |
| Sioux | 0.0 /100 | #304 | Tragic 38.5% |
| Immigrants | Honduras | 0.0 /100 | #305 | Tragic 38.5% |
| Shoshone | 0.0 /100 | #306 | Tragic 38.4% |
| Immigrants | El Salvador | 0.0 /100 | #307 | Tragic 38.4% |
| Mexican American Indians | 0.0 /100 | #308 | Tragic 38.2% |
| Immigrants | Guatemala | 0.0 /100 | #309 | Tragic 38.1% |
| Immigrants | Dominican Republic | 0.0 /100 | #310 | Tragic 37.9% |
| Immigrants | Latin America | 0.0 /100 | #311 | Tragic 37.9% |
| Choctaw | 0.0 /100 | #312 | Tragic 37.8% |
| Hispanics or Latinos | 0.0 /100 | #313 | Tragic 37.7% |
| Seminole | 0.0 /100 | #314 | Tragic 37.7% |
| Creek | 0.0 /100 | #315 | Tragic 37.6% |
| Crow | 0.0 /100 | #316 | Tragic 37.6% |
| Yaqui | 0.0 /100 | #317 | Tragic 37.6% |