Immigrants from Western Asia vs Immigrants from Dominican Republic Associate's Degree
COMPARE
Immigrants from Western Asia
Immigrants from Dominican Republic
Associate's Degree
Associate's Degree Comparison
Immigrants from Western Asia
Immigrants from Dominican Republic
50.1%
ASSOCIATE'S DEGREE
98.7/ 100
METRIC RATING
91st/ 347
METRIC RANK
37.9%
ASSOCIATE'S DEGREE
0.0/ 100
METRIC RATING
310th/ 347
METRIC RANK
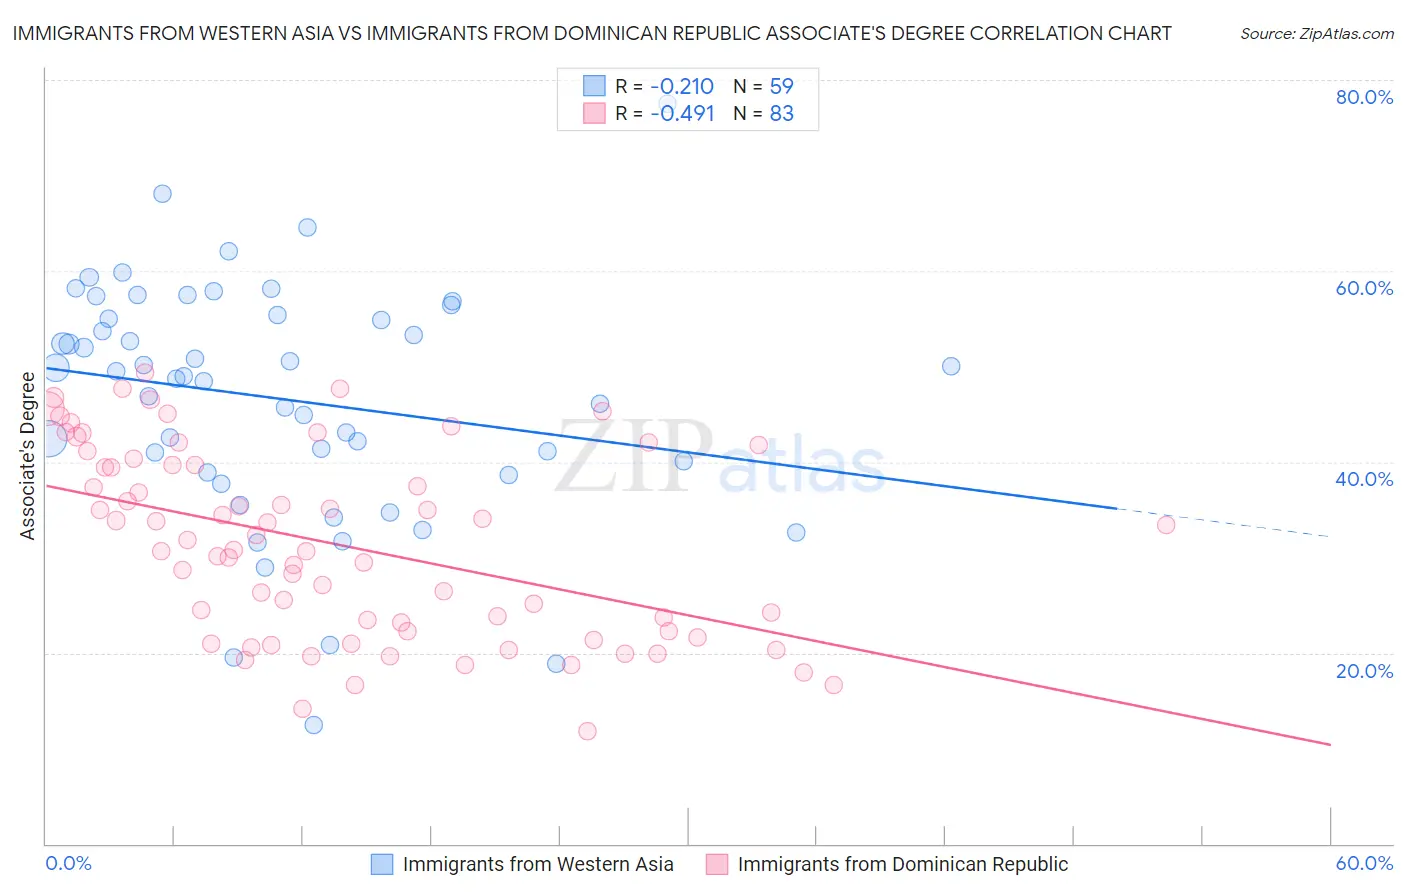
Immigrants from Western Asia vs Immigrants from Dominican Republic Associate's Degree Correlation Chart
The statistical analysis conducted on geographies consisting of 404,416,619 people shows a weak negative correlation between the proportion of Immigrants from Western Asia and percentage of population with at least associate's degree education in the United States with a correlation coefficient (R) of -0.210 and weighted average of 50.1%. Similarly, the statistical analysis conducted on geographies consisting of 275,132,168 people shows a moderate negative correlation between the proportion of Immigrants from Dominican Republic and percentage of population with at least associate's degree education in the United States with a correlation coefficient (R) of -0.491 and weighted average of 37.9%, a difference of 32.1%.
Associate's Degree Correlation Summary
| Measurement | Immigrants from Western Asia | Immigrants from Dominican Republic |
| Minimum | 12.5% | 11.8% |
| Maximum | 77.6% | 49.4% |
| Range | 65.1% | 37.6% |
| Mean | 46.5% | 31.3% |
| Median | 48.9% | 30.8% |
| Interquartile 25% (IQ1) | 38.9% | 22.2% |
| Interquartile 75% (IQ3) | 55.4% | 39.7% |
| Interquartile Range (IQR) | 16.5% | 17.5% |
| Standard Deviation (Sample) | 12.5% | 9.8% |
| Standard Deviation (Population) | 12.4% | 9.7% |
Similar Demographics by Associate's Degree
Demographics Similar to Immigrants from Western Asia by Associate's Degree
In terms of associate's degree, the demographic groups most similar to Immigrants from Western Asia are Immigrants from North America (50.1%, a difference of 0.020%), Immigrants from Western Europe (50.1%, a difference of 0.080%), Immigrants from Ethiopia (50.1%, a difference of 0.080%), Immigrants from Canada (50.1%, a difference of 0.090%), and Immigrants from Moldova (50.2%, a difference of 0.16%).
| Demographics | Rating | Rank | Associate's Degree |
| Immigrants | Hungary | 98.9 /100 | #84 | Exceptional 50.2% |
| Immigrants | Egypt | 98.9 /100 | #85 | Exceptional 50.2% |
| Immigrants | Croatia | 98.9 /100 | #86 | Exceptional 50.2% |
| Immigrants | Moldova | 98.8 /100 | #87 | Exceptional 50.2% |
| Immigrants | Canada | 98.7 /100 | #88 | Exceptional 50.1% |
| Immigrants | Western Europe | 98.7 /100 | #89 | Exceptional 50.1% |
| Immigrants | Ethiopia | 98.7 /100 | #90 | Exceptional 50.1% |
| Immigrants | Western Asia | 98.7 /100 | #91 | Exceptional 50.1% |
| Immigrants | North America | 98.7 /100 | #92 | Exceptional 50.1% |
| Immigrants | Brazil | 98.5 /100 | #93 | Exceptional 50.0% |
| Laotians | 98.4 /100 | #94 | Exceptional 49.9% |
| Immigrants | England | 98.0 /100 | #95 | Exceptional 49.7% |
| Romanians | 98.0 /100 | #96 | Exceptional 49.7% |
| Immigrants | Ukraine | 98.0 /100 | #97 | Exceptional 49.7% |
| Immigrants | Northern Africa | 97.9 /100 | #98 | Exceptional 49.7% |
Demographics Similar to Immigrants from Dominican Republic by Associate's Degree
In terms of associate's degree, the demographic groups most similar to Immigrants from Dominican Republic are Immigrants from Latin America (37.9%, a difference of 0.11%), Choctaw (37.8%, a difference of 0.33%), Hispanic or Latino (37.7%, a difference of 0.48%), Seminole (37.7%, a difference of 0.53%), and Immigrants from Guatemala (38.1%, a difference of 0.62%).
| Demographics | Rating | Rank | Associate's Degree |
| Guatemalans | 0.0 /100 | #303 | Tragic 38.5% |
| Sioux | 0.0 /100 | #304 | Tragic 38.5% |
| Immigrants | Honduras | 0.0 /100 | #305 | Tragic 38.5% |
| Shoshone | 0.0 /100 | #306 | Tragic 38.4% |
| Immigrants | El Salvador | 0.0 /100 | #307 | Tragic 38.4% |
| Mexican American Indians | 0.0 /100 | #308 | Tragic 38.2% |
| Immigrants | Guatemala | 0.0 /100 | #309 | Tragic 38.1% |
| Immigrants | Dominican Republic | 0.0 /100 | #310 | Tragic 37.9% |
| Immigrants | Latin America | 0.0 /100 | #311 | Tragic 37.9% |
| Choctaw | 0.0 /100 | #312 | Tragic 37.8% |
| Hispanics or Latinos | 0.0 /100 | #313 | Tragic 37.7% |
| Seminole | 0.0 /100 | #314 | Tragic 37.7% |
| Creek | 0.0 /100 | #315 | Tragic 37.6% |
| Crow | 0.0 /100 | #316 | Tragic 37.6% |
| Yaqui | 0.0 /100 | #317 | Tragic 37.6% |