Japanese vs Ukrainian Associate's Degree
COMPARE
Japanese
Ukrainian
Associate's Degree
Associate's Degree Comparison
Japanese
Ukrainians
41.7%
ASSOCIATE'S DEGREE
0.5/ 100
METRIC RATING
258th/ 347
METRIC RANK
49.4%
ASSOCIATE'S DEGREE
97.1/ 100
METRIC RATING
103rd/ 347
METRIC RANK
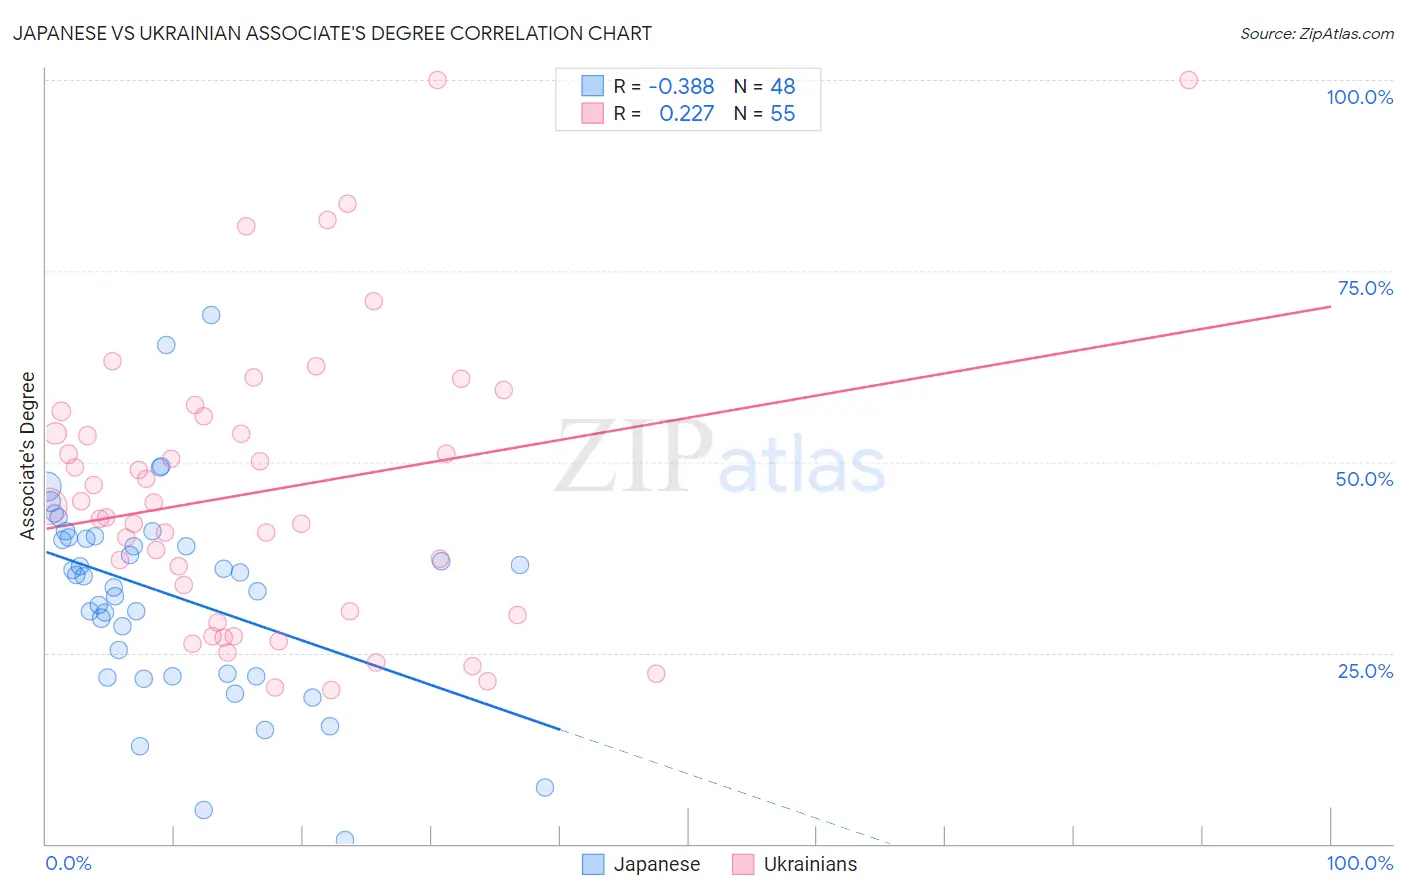
Japanese vs Ukrainian Associate's Degree Correlation Chart
The statistical analysis conducted on geographies consisting of 249,174,886 people shows a mild negative correlation between the proportion of Japanese and percentage of population with at least associate's degree education in the United States with a correlation coefficient (R) of -0.388 and weighted average of 41.7%. Similarly, the statistical analysis conducted on geographies consisting of 448,659,319 people shows a weak positive correlation between the proportion of Ukrainians and percentage of population with at least associate's degree education in the United States with a correlation coefficient (R) of 0.227 and weighted average of 49.4%, a difference of 18.5%.
Associate's Degree Correlation Summary
| Measurement | Japanese | Ukrainian |
| Minimum | 0.50% | 20.1% |
| Maximum | 69.2% | 100.0% |
| Range | 68.7% | 79.9% |
| Mean | 32.6% | 46.1% |
| Median | 35.1% | 44.1% |
| Interquartile 25% (IQ1) | 22.1% | 30.0% |
| Interquartile 75% (IQ3) | 40.0% | 56.0% |
| Interquartile Range (IQR) | 17.9% | 26.0% |
| Standard Deviation (Sample) | 13.5% | 18.9% |
| Standard Deviation (Population) | 13.4% | 18.8% |
Similar Demographics by Associate's Degree
Demographics Similar to Japanese by Associate's Degree
In terms of associate's degree, the demographic groups most similar to Japanese are Malaysian (41.6%, a difference of 0.10%), Spanish American (41.8%, a difference of 0.22%), Immigrants from Congo (41.8%, a difference of 0.27%), Marshallese (41.6%, a difference of 0.30%), and Immigrants from Guyana (41.8%, a difference of 0.40%).
| Demographics | Rating | Rank | Associate's Degree |
| Immigrants | Bahamas | 0.7 /100 | #251 | Tragic 42.1% |
| French American Indians | 0.6 /100 | #252 | Tragic 42.0% |
| Indonesians | 0.6 /100 | #253 | Tragic 41.9% |
| Cubans | 0.6 /100 | #254 | Tragic 41.9% |
| Immigrants | Guyana | 0.5 /100 | #255 | Tragic 41.8% |
| Immigrants | Congo | 0.5 /100 | #256 | Tragic 41.8% |
| Spanish Americans | 0.5 /100 | #257 | Tragic 41.8% |
| Japanese | 0.5 /100 | #258 | Tragic 41.7% |
| Malaysians | 0.4 /100 | #259 | Tragic 41.6% |
| Marshallese | 0.4 /100 | #260 | Tragic 41.6% |
| Nicaraguans | 0.4 /100 | #261 | Tragic 41.5% |
| Bahamians | 0.4 /100 | #262 | Tragic 41.5% |
| Immigrants | Jamaica | 0.3 /100 | #263 | Tragic 41.5% |
| Osage | 0.3 /100 | #264 | Tragic 41.5% |
| Africans | 0.2 /100 | #265 | Tragic 41.1% |
Demographics Similar to Ukrainians by Associate's Degree
In terms of associate's degree, the demographic groups most similar to Ukrainians are Venezuelan (49.4%, a difference of 0.060%), Chilean (49.4%, a difference of 0.11%), Northern European (49.5%, a difference of 0.13%), Croatian (49.3%, a difference of 0.21%), and Immigrants from Italy (49.3%, a difference of 0.21%).
| Demographics | Rating | Rank | Associate's Degree |
| Romanians | 98.0 /100 | #96 | Exceptional 49.7% |
| Immigrants | Ukraine | 98.0 /100 | #97 | Exceptional 49.7% |
| Immigrants | Northern Africa | 97.9 /100 | #98 | Exceptional 49.7% |
| Macedonians | 97.8 /100 | #99 | Exceptional 49.6% |
| Immigrants | Nepal | 97.5 /100 | #100 | Exceptional 49.5% |
| Northern Europeans | 97.3 /100 | #101 | Exceptional 49.5% |
| Chileans | 97.3 /100 | #102 | Exceptional 49.4% |
| Ukrainians | 97.1 /100 | #103 | Exceptional 49.4% |
| Venezuelans | 97.0 /100 | #104 | Exceptional 49.4% |
| Croatians | 96.8 /100 | #105 | Exceptional 49.3% |
| Immigrants | Italy | 96.7 /100 | #106 | Exceptional 49.3% |
| Syrians | 96.7 /100 | #107 | Exceptional 49.3% |
| Jordanians | 96.6 /100 | #108 | Exceptional 49.2% |
| Immigrants | Morocco | 96.3 /100 | #109 | Exceptional 49.2% |
| Austrians | 95.8 /100 | #110 | Exceptional 49.1% |