Japanese vs Immigrants from Australia Associate's Degree
COMPARE
Japanese
Immigrants from Australia
Associate's Degree
Associate's Degree Comparison
Japanese
Immigrants from Australia
41.7%
ASSOCIATE'S DEGREE
0.5/ 100
METRIC RATING
258th/ 347
METRIC RANK
55.8%
ASSOCIATE'S DEGREE
100.0/ 100
METRIC RATING
11th/ 347
METRIC RANK
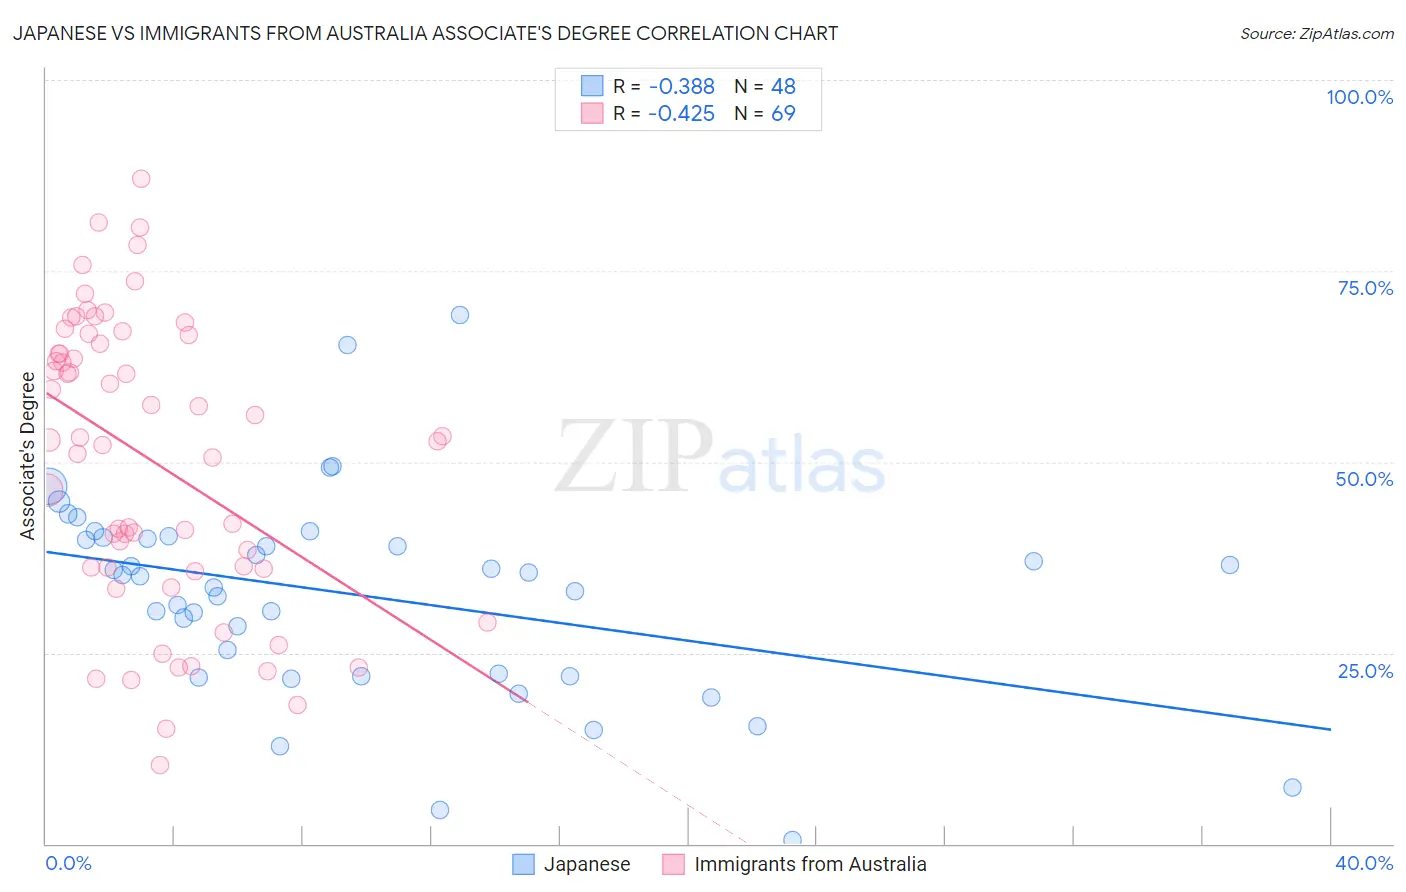
Japanese vs Immigrants from Australia Associate's Degree Correlation Chart
The statistical analysis conducted on geographies consisting of 249,174,886 people shows a mild negative correlation between the proportion of Japanese and percentage of population with at least associate's degree education in the United States with a correlation coefficient (R) of -0.388 and weighted average of 41.7%. Similarly, the statistical analysis conducted on geographies consisting of 227,202,570 people shows a moderate negative correlation between the proportion of Immigrants from Australia and percentage of population with at least associate's degree education in the United States with a correlation coefficient (R) of -0.425 and weighted average of 55.8%, a difference of 33.9%.
Associate's Degree Correlation Summary
| Measurement | Japanese | Immigrants from Australia |
| Minimum | 0.50% | 10.3% |
| Maximum | 69.2% | 87.2% |
| Range | 68.7% | 76.8% |
| Mean | 32.6% | 50.2% |
| Median | 35.1% | 52.9% |
| Interquartile 25% (IQ1) | 22.1% | 36.0% |
| Interquartile 75% (IQ3) | 40.0% | 66.1% |
| Interquartile Range (IQR) | 17.9% | 30.0% |
| Standard Deviation (Sample) | 13.5% | 18.8% |
| Standard Deviation (Population) | 13.4% | 18.7% |
Similar Demographics by Associate's Degree
Demographics Similar to Japanese by Associate's Degree
In terms of associate's degree, the demographic groups most similar to Japanese are Malaysian (41.6%, a difference of 0.10%), Spanish American (41.8%, a difference of 0.22%), Immigrants from Congo (41.8%, a difference of 0.27%), Marshallese (41.6%, a difference of 0.30%), and Immigrants from Guyana (41.8%, a difference of 0.40%).
| Demographics | Rating | Rank | Associate's Degree |
| Immigrants | Bahamas | 0.7 /100 | #251 | Tragic 42.1% |
| French American Indians | 0.6 /100 | #252 | Tragic 42.0% |
| Indonesians | 0.6 /100 | #253 | Tragic 41.9% |
| Cubans | 0.6 /100 | #254 | Tragic 41.9% |
| Immigrants | Guyana | 0.5 /100 | #255 | Tragic 41.8% |
| Immigrants | Congo | 0.5 /100 | #256 | Tragic 41.8% |
| Spanish Americans | 0.5 /100 | #257 | Tragic 41.8% |
| Japanese | 0.5 /100 | #258 | Tragic 41.7% |
| Malaysians | 0.4 /100 | #259 | Tragic 41.6% |
| Marshallese | 0.4 /100 | #260 | Tragic 41.6% |
| Nicaraguans | 0.4 /100 | #261 | Tragic 41.5% |
| Bahamians | 0.4 /100 | #262 | Tragic 41.5% |
| Immigrants | Jamaica | 0.3 /100 | #263 | Tragic 41.5% |
| Osage | 0.3 /100 | #264 | Tragic 41.5% |
| Africans | 0.2 /100 | #265 | Tragic 41.1% |
Demographics Similar to Immigrants from Australia by Associate's Degree
In terms of associate's degree, the demographic groups most similar to Immigrants from Australia are Immigrants from South Central Asia (55.7%, a difference of 0.12%), Immigrants from China (55.5%, a difference of 0.61%), Immigrants from Hong Kong (55.4%, a difference of 0.76%), Immigrants from Eastern Asia (55.4%, a difference of 0.79%), and Cypriot (56.4%, a difference of 1.0%).
| Demographics | Rating | Rank | Associate's Degree |
| Immigrants | Taiwan | 100.0 /100 | #4 | Exceptional 58.4% |
| Iranians | 100.0 /100 | #5 | Exceptional 58.2% |
| Okinawans | 100.0 /100 | #6 | Exceptional 57.7% |
| Immigrants | Iran | 100.0 /100 | #7 | Exceptional 57.7% |
| Thais | 100.0 /100 | #8 | Exceptional 57.4% |
| Immigrants | Israel | 100.0 /100 | #9 | Exceptional 56.8% |
| Cypriots | 100.0 /100 | #10 | Exceptional 56.4% |
| Immigrants | Australia | 100.0 /100 | #11 | Exceptional 55.8% |
| Immigrants | South Central Asia | 100.0 /100 | #12 | Exceptional 55.7% |
| Immigrants | China | 100.0 /100 | #13 | Exceptional 55.5% |
| Immigrants | Hong Kong | 100.0 /100 | #14 | Exceptional 55.4% |
| Immigrants | Eastern Asia | 100.0 /100 | #15 | Exceptional 55.4% |
| Soviet Union | 100.0 /100 | #16 | Exceptional 55.1% |
| Eastern Europeans | 100.0 /100 | #17 | Exceptional 55.0% |
| Indians (Asian) | 100.0 /100 | #18 | Exceptional 54.8% |