Japanese vs Syrian Associate's Degree
COMPARE
Japanese
Syrian
Associate's Degree
Associate's Degree Comparison
Japanese
Syrians
41.7%
ASSOCIATE'S DEGREE
0.5/ 100
METRIC RATING
258th/ 347
METRIC RANK
49.3%
ASSOCIATE'S DEGREE
96.7/ 100
METRIC RATING
107th/ 347
METRIC RANK
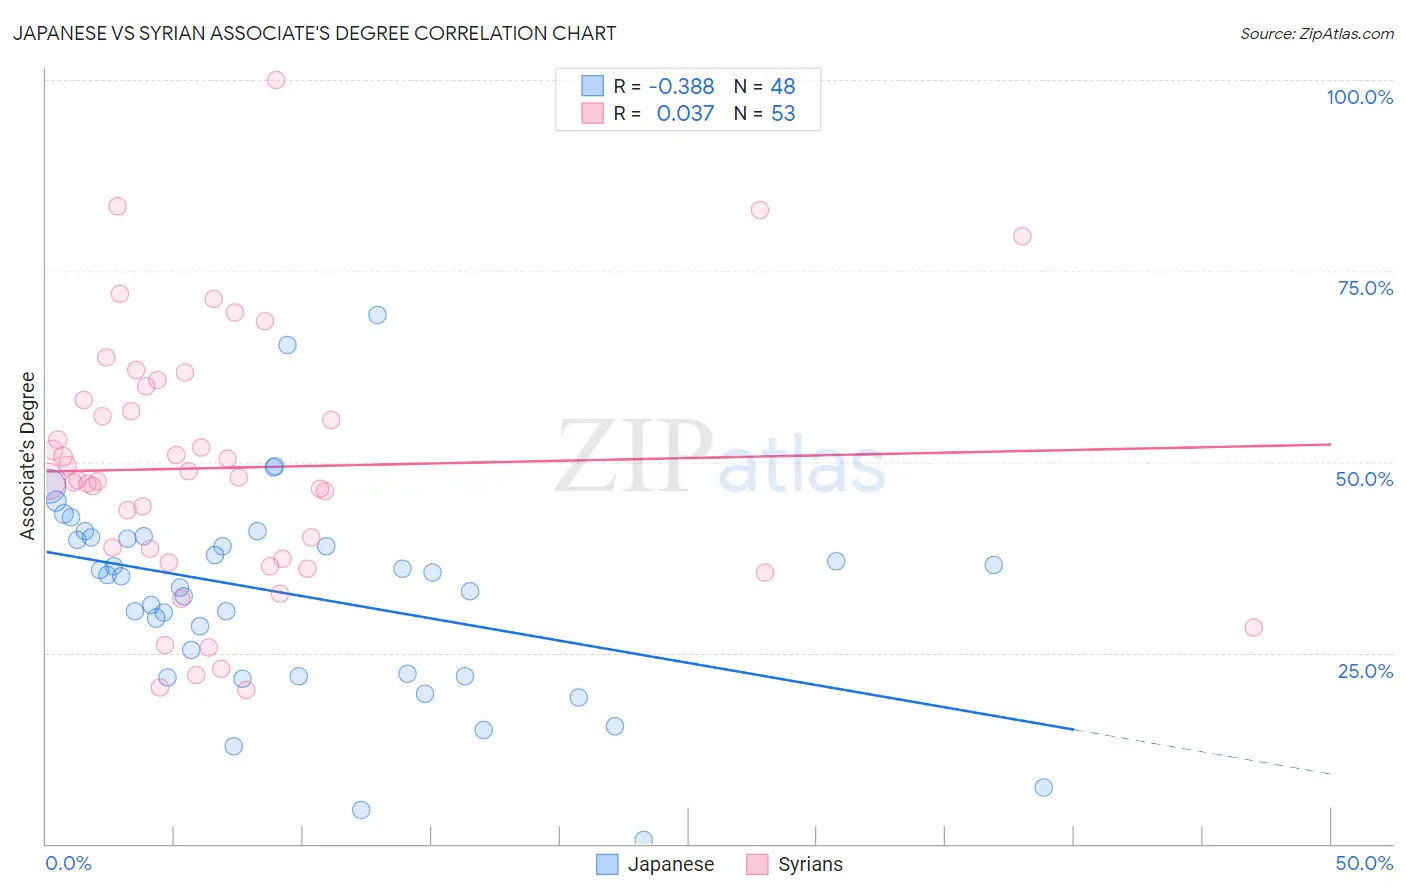
Japanese vs Syrian Associate's Degree Correlation Chart
The statistical analysis conducted on geographies consisting of 249,174,886 people shows a mild negative correlation between the proportion of Japanese and percentage of population with at least associate's degree education in the United States with a correlation coefficient (R) of -0.388 and weighted average of 41.7%. Similarly, the statistical analysis conducted on geographies consisting of 266,303,320 people shows no correlation between the proportion of Syrians and percentage of population with at least associate's degree education in the United States with a correlation coefficient (R) of 0.037 and weighted average of 49.3%, a difference of 18.2%.
Associate's Degree Correlation Summary
| Measurement | Japanese | Syrian |
| Minimum | 0.50% | 20.2% |
| Maximum | 69.2% | 100.0% |
| Range | 68.7% | 79.8% |
| Mean | 32.6% | 49.2% |
| Median | 35.1% | 47.6% |
| Interquartile 25% (IQ1) | 22.1% | 37.1% |
| Interquartile 75% (IQ3) | 40.0% | 59.0% |
| Interquartile Range (IQR) | 17.9% | 21.9% |
| Standard Deviation (Sample) | 13.5% | 17.0% |
| Standard Deviation (Population) | 13.4% | 16.9% |
Similar Demographics by Associate's Degree
Demographics Similar to Japanese by Associate's Degree
In terms of associate's degree, the demographic groups most similar to Japanese are Malaysian (41.6%, a difference of 0.10%), Spanish American (41.8%, a difference of 0.22%), Immigrants from Congo (41.8%, a difference of 0.27%), Marshallese (41.6%, a difference of 0.30%), and Immigrants from Guyana (41.8%, a difference of 0.40%).
| Demographics | Rating | Rank | Associate's Degree |
| Immigrants | Bahamas | 0.7 /100 | #251 | Tragic 42.1% |
| French American Indians | 0.6 /100 | #252 | Tragic 42.0% |
| Indonesians | 0.6 /100 | #253 | Tragic 41.9% |
| Cubans | 0.6 /100 | #254 | Tragic 41.9% |
| Immigrants | Guyana | 0.5 /100 | #255 | Tragic 41.8% |
| Immigrants | Congo | 0.5 /100 | #256 | Tragic 41.8% |
| Spanish Americans | 0.5 /100 | #257 | Tragic 41.8% |
| Japanese | 0.5 /100 | #258 | Tragic 41.7% |
| Malaysians | 0.4 /100 | #259 | Tragic 41.6% |
| Marshallese | 0.4 /100 | #260 | Tragic 41.6% |
| Nicaraguans | 0.4 /100 | #261 | Tragic 41.5% |
| Bahamians | 0.4 /100 | #262 | Tragic 41.5% |
| Immigrants | Jamaica | 0.3 /100 | #263 | Tragic 41.5% |
| Osage | 0.3 /100 | #264 | Tragic 41.5% |
| Africans | 0.2 /100 | #265 | Tragic 41.1% |
Demographics Similar to Syrians by Associate's Degree
In terms of associate's degree, the demographic groups most similar to Syrians are Croatian (49.3%, a difference of 0.030%), Immigrants from Italy (49.3%, a difference of 0.030%), Jordanian (49.2%, a difference of 0.060%), Venezuelan (49.4%, a difference of 0.18%), and Immigrants from Morocco (49.2%, a difference of 0.20%).
| Demographics | Rating | Rank | Associate's Degree |
| Immigrants | Nepal | 97.5 /100 | #100 | Exceptional 49.5% |
| Northern Europeans | 97.3 /100 | #101 | Exceptional 49.5% |
| Chileans | 97.3 /100 | #102 | Exceptional 49.4% |
| Ukrainians | 97.1 /100 | #103 | Exceptional 49.4% |
| Venezuelans | 97.0 /100 | #104 | Exceptional 49.4% |
| Croatians | 96.8 /100 | #105 | Exceptional 49.3% |
| Immigrants | Italy | 96.7 /100 | #106 | Exceptional 49.3% |
| Syrians | 96.7 /100 | #107 | Exceptional 49.3% |
| Jordanians | 96.6 /100 | #108 | Exceptional 49.2% |
| Immigrants | Morocco | 96.3 /100 | #109 | Exceptional 49.2% |
| Austrians | 95.8 /100 | #110 | Exceptional 49.1% |
| Immigrants | Venezuela | 95.8 /100 | #111 | Exceptional 49.1% |
| Immigrants | Chile | 95.3 /100 | #112 | Exceptional 49.0% |
| Palestinians | 95.3 /100 | #113 | Exceptional 49.0% |
| Arabs | 95.3 /100 | #114 | Exceptional 49.0% |