Immigrants from Korea vs Immigrants from Dominican Republic Associate's Degree
COMPARE
Immigrants from Korea
Immigrants from Dominican Republic
Associate's Degree
Associate's Degree Comparison
Immigrants from Korea
Immigrants from Dominican Republic
54.5%
ASSOCIATE'S DEGREE
100.0/ 100
METRIC RATING
24th/ 347
METRIC RANK
37.9%
ASSOCIATE'S DEGREE
0.0/ 100
METRIC RATING
310th/ 347
METRIC RANK
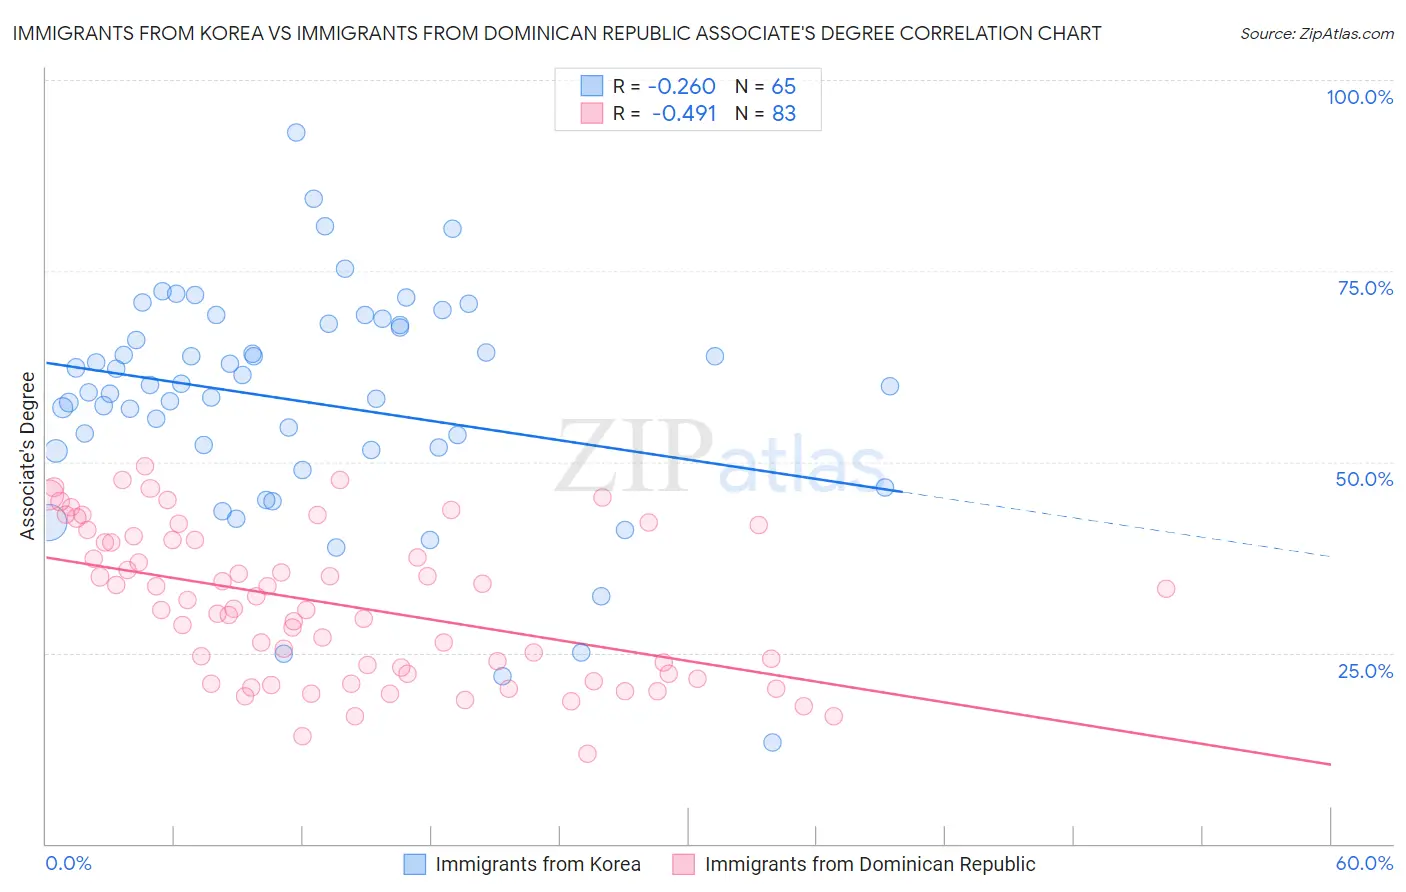
Immigrants from Korea vs Immigrants from Dominican Republic Associate's Degree Correlation Chart
The statistical analysis conducted on geographies consisting of 416,302,592 people shows a weak negative correlation between the proportion of Immigrants from Korea and percentage of population with at least associate's degree education in the United States with a correlation coefficient (R) of -0.260 and weighted average of 54.5%. Similarly, the statistical analysis conducted on geographies consisting of 275,132,168 people shows a moderate negative correlation between the proportion of Immigrants from Dominican Republic and percentage of population with at least associate's degree education in the United States with a correlation coefficient (R) of -0.491 and weighted average of 37.9%, a difference of 43.9%.
Associate's Degree Correlation Summary
| Measurement | Immigrants from Korea | Immigrants from Dominican Republic |
| Minimum | 13.3% | 11.8% |
| Maximum | 93.1% | 49.4% |
| Range | 79.9% | 37.6% |
| Mean | 57.9% | 31.3% |
| Median | 59.9% | 30.8% |
| Interquartile 25% (IQ1) | 51.4% | 22.2% |
| Interquartile 75% (IQ3) | 68.0% | 39.7% |
| Interquartile Range (IQR) | 16.5% | 17.5% |
| Standard Deviation (Sample) | 14.9% | 9.8% |
| Standard Deviation (Population) | 14.8% | 9.7% |
Similar Demographics by Associate's Degree
Demographics Similar to Immigrants from Korea by Associate's Degree
In terms of associate's degree, the demographic groups most similar to Immigrants from Korea are Immigrants from Switzerland (54.5%, a difference of 0.030%), Immigrants from Belgium (54.5%, a difference of 0.070%), Immigrants from Japan (54.6%, a difference of 0.090%), Burmese (54.6%, a difference of 0.090%), and Immigrants from Sweden (54.6%, a difference of 0.12%).
| Demographics | Rating | Rank | Associate's Degree |
| Eastern Europeans | 100.0 /100 | #17 | Exceptional 55.0% |
| Indians (Asian) | 100.0 /100 | #18 | Exceptional 54.8% |
| Immigrants | Ireland | 100.0 /100 | #19 | Exceptional 54.7% |
| Cambodians | 100.0 /100 | #20 | Exceptional 54.6% |
| Immigrants | Sweden | 100.0 /100 | #21 | Exceptional 54.6% |
| Immigrants | Japan | 100.0 /100 | #22 | Exceptional 54.6% |
| Burmese | 100.0 /100 | #23 | Exceptional 54.6% |
| Immigrants | Korea | 100.0 /100 | #24 | Exceptional 54.5% |
| Immigrants | Switzerland | 100.0 /100 | #25 | Exceptional 54.5% |
| Immigrants | Belgium | 100.0 /100 | #26 | Exceptional 54.5% |
| Latvians | 100.0 /100 | #27 | Exceptional 53.9% |
| Turks | 100.0 /100 | #28 | Exceptional 53.9% |
| Immigrants | France | 100.0 /100 | #29 | Exceptional 53.9% |
| Immigrants | Sri Lanka | 100.0 /100 | #30 | Exceptional 53.7% |
| Immigrants | Northern Europe | 100.0 /100 | #31 | Exceptional 53.5% |
Demographics Similar to Immigrants from Dominican Republic by Associate's Degree
In terms of associate's degree, the demographic groups most similar to Immigrants from Dominican Republic are Immigrants from Latin America (37.9%, a difference of 0.11%), Choctaw (37.8%, a difference of 0.33%), Hispanic or Latino (37.7%, a difference of 0.48%), Seminole (37.7%, a difference of 0.53%), and Immigrants from Guatemala (38.1%, a difference of 0.62%).
| Demographics | Rating | Rank | Associate's Degree |
| Guatemalans | 0.0 /100 | #303 | Tragic 38.5% |
| Sioux | 0.0 /100 | #304 | Tragic 38.5% |
| Immigrants | Honduras | 0.0 /100 | #305 | Tragic 38.5% |
| Shoshone | 0.0 /100 | #306 | Tragic 38.4% |
| Immigrants | El Salvador | 0.0 /100 | #307 | Tragic 38.4% |
| Mexican American Indians | 0.0 /100 | #308 | Tragic 38.2% |
| Immigrants | Guatemala | 0.0 /100 | #309 | Tragic 38.1% |
| Immigrants | Dominican Republic | 0.0 /100 | #310 | Tragic 37.9% |
| Immigrants | Latin America | 0.0 /100 | #311 | Tragic 37.9% |
| Choctaw | 0.0 /100 | #312 | Tragic 37.8% |
| Hispanics or Latinos | 0.0 /100 | #313 | Tragic 37.7% |
| Seminole | 0.0 /100 | #314 | Tragic 37.7% |
| Creek | 0.0 /100 | #315 | Tragic 37.6% |
| Crow | 0.0 /100 | #316 | Tragic 37.6% |
| Yaqui | 0.0 /100 | #317 | Tragic 37.6% |