Japanese vs Tohono O'odham Associate's Degree
COMPARE
Japanese
Tohono O'odham
Associate's Degree
Associate's Degree Comparison
Japanese
Tohono O'odham
41.7%
ASSOCIATE'S DEGREE
0.5/ 100
METRIC RATING
258th/ 347
METRIC RANK
31.8%
ASSOCIATE'S DEGREE
0.0/ 100
METRIC RATING
343rd/ 347
METRIC RANK
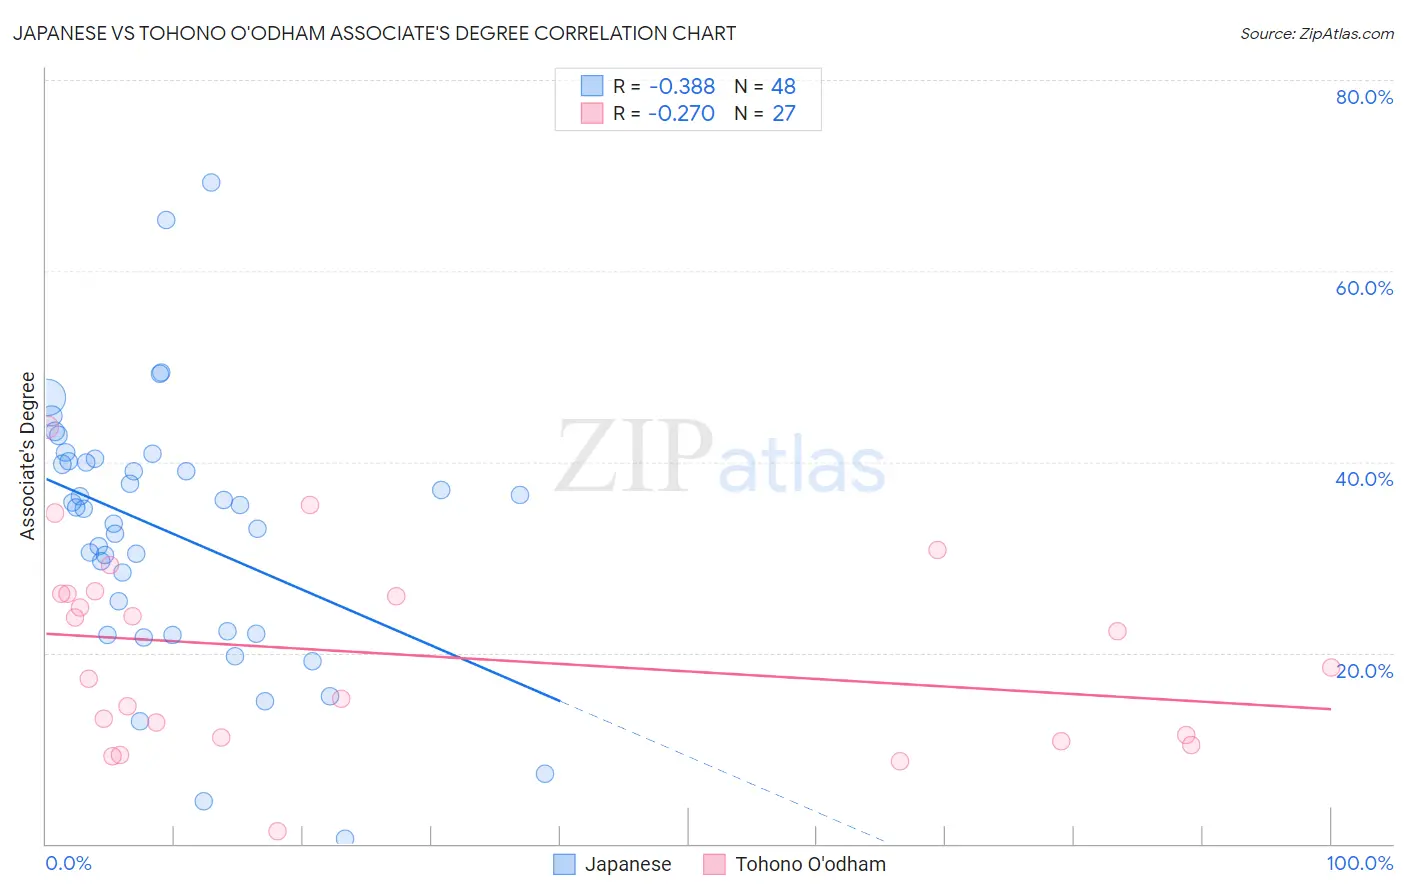
Japanese vs Tohono O'odham Associate's Degree Correlation Chart
The statistical analysis conducted on geographies consisting of 249,174,886 people shows a mild negative correlation between the proportion of Japanese and percentage of population with at least associate's degree education in the United States with a correlation coefficient (R) of -0.388 and weighted average of 41.7%. Similarly, the statistical analysis conducted on geographies consisting of 58,725,971 people shows a weak negative correlation between the proportion of Tohono O'odham and percentage of population with at least associate's degree education in the United States with a correlation coefficient (R) of -0.270 and weighted average of 31.8%, a difference of 31.2%.
Associate's Degree Correlation Summary
| Measurement | Japanese | Tohono O'odham |
| Minimum | 0.50% | 1.3% |
| Maximum | 69.2% | 43.7% |
| Range | 68.7% | 42.4% |
| Mean | 32.6% | 19.8% |
| Median | 35.1% | 18.5% |
| Interquartile 25% (IQ1) | 22.1% | 11.2% |
| Interquartile 75% (IQ3) | 40.0% | 26.2% |
| Interquartile Range (IQR) | 17.9% | 15.1% |
| Standard Deviation (Sample) | 13.5% | 10.1% |
| Standard Deviation (Population) | 13.4% | 9.9% |
Similar Demographics by Associate's Degree
Demographics Similar to Japanese by Associate's Degree
In terms of associate's degree, the demographic groups most similar to Japanese are Malaysian (41.6%, a difference of 0.10%), Spanish American (41.8%, a difference of 0.22%), Immigrants from Congo (41.8%, a difference of 0.27%), Marshallese (41.6%, a difference of 0.30%), and Immigrants from Guyana (41.8%, a difference of 0.40%).
| Demographics | Rating | Rank | Associate's Degree |
| Immigrants | Bahamas | 0.7 /100 | #251 | Tragic 42.1% |
| French American Indians | 0.6 /100 | #252 | Tragic 42.0% |
| Indonesians | 0.6 /100 | #253 | Tragic 41.9% |
| Cubans | 0.6 /100 | #254 | Tragic 41.9% |
| Immigrants | Guyana | 0.5 /100 | #255 | Tragic 41.8% |
| Immigrants | Congo | 0.5 /100 | #256 | Tragic 41.8% |
| Spanish Americans | 0.5 /100 | #257 | Tragic 41.8% |
| Japanese | 0.5 /100 | #258 | Tragic 41.7% |
| Malaysians | 0.4 /100 | #259 | Tragic 41.6% |
| Marshallese | 0.4 /100 | #260 | Tragic 41.6% |
| Nicaraguans | 0.4 /100 | #261 | Tragic 41.5% |
| Bahamians | 0.4 /100 | #262 | Tragic 41.5% |
| Immigrants | Jamaica | 0.3 /100 | #263 | Tragic 41.5% |
| Osage | 0.3 /100 | #264 | Tragic 41.5% |
| Africans | 0.2 /100 | #265 | Tragic 41.1% |
Demographics Similar to Tohono O'odham by Associate's Degree
In terms of associate's degree, the demographic groups most similar to Tohono O'odham are Yuman (31.3%, a difference of 1.7%), Yakama (32.3%, a difference of 1.7%), Inupiat (32.6%, a difference of 2.5%), Navajo (32.6%, a difference of 2.5%), and Pima (30.2%, a difference of 5.1%).
| Demographics | Rating | Rank | Associate's Degree |
| Mexicans | 0.0 /100 | #333 | Tragic 35.0% |
| Natives/Alaskans | 0.0 /100 | #334 | Tragic 34.9% |
| Spanish American Indians | 0.0 /100 | #335 | Tragic 34.9% |
| Hopi | 0.0 /100 | #336 | Tragic 34.6% |
| Lumbee | 0.0 /100 | #337 | Tragic 34.1% |
| Pueblo | 0.0 /100 | #338 | Tragic 34.0% |
| Immigrants | Mexico | 0.0 /100 | #339 | Tragic 33.7% |
| Navajo | 0.0 /100 | #340 | Tragic 32.6% |
| Inupiat | 0.0 /100 | #341 | Tragic 32.6% |
| Yakama | 0.0 /100 | #342 | Tragic 32.3% |
| Tohono O'odham | 0.0 /100 | #343 | Tragic 31.8% |
| Yuman | 0.0 /100 | #344 | Tragic 31.3% |
| Pima | 0.0 /100 | #345 | Tragic 30.2% |
| Houma | 0.0 /100 | #346 | Tragic 28.2% |
| Yup'ik | 0.0 /100 | #347 | Tragic 25.0% |