Dominican vs Immigrants from Dominican Republic Associate's Degree
COMPARE
Dominican
Immigrants from Dominican Republic
Associate's Degree
Associate's Degree Comparison
Dominicans
Immigrants from Dominican Republic
39.3%
ASSOCIATE'S DEGREE
0.0/ 100
METRIC RATING
291st/ 347
METRIC RANK
37.9%
ASSOCIATE'S DEGREE
0.0/ 100
METRIC RATING
310th/ 347
METRIC RANK
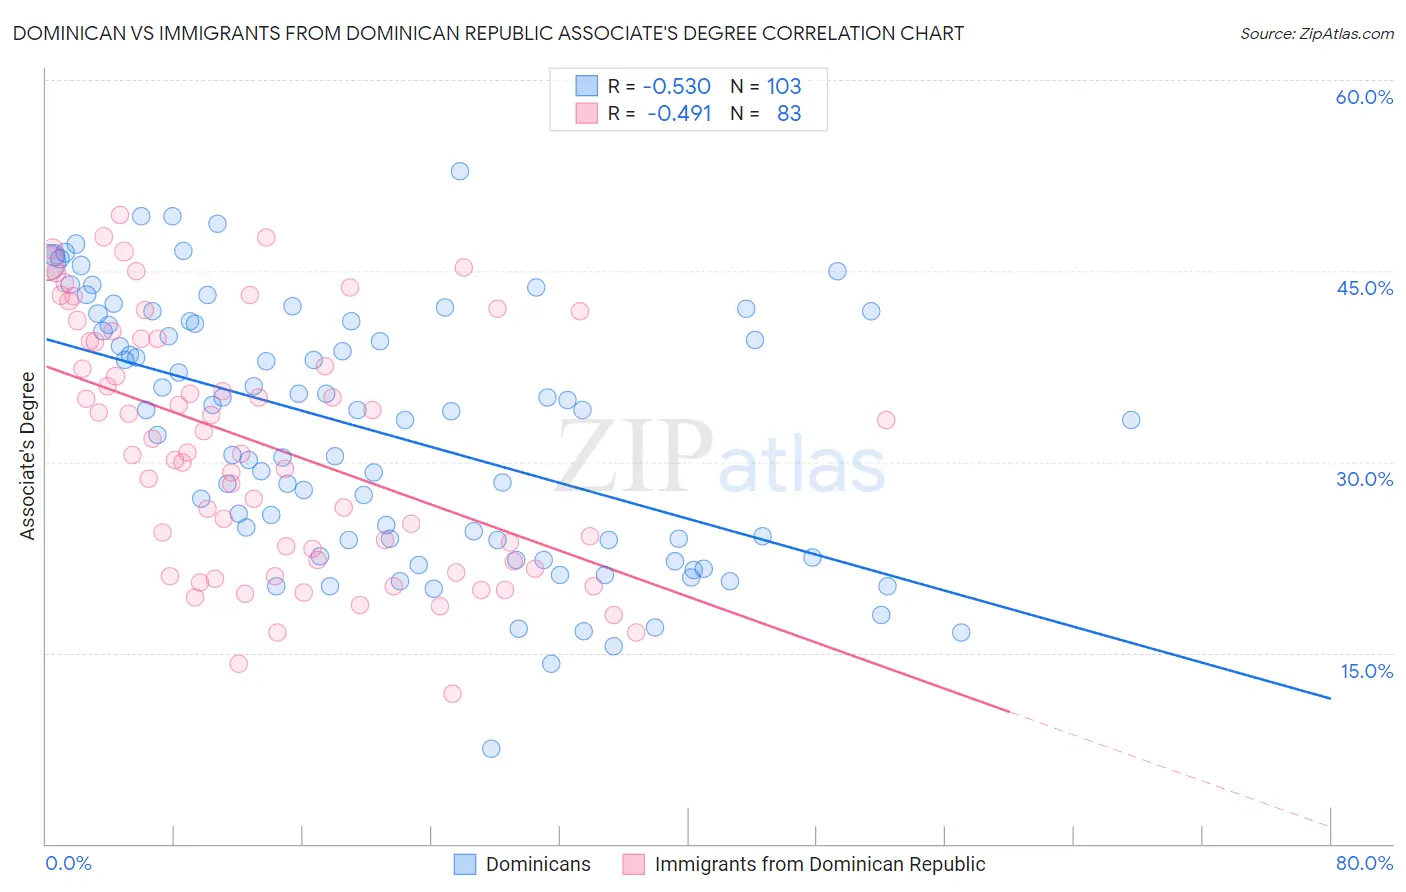
Dominican vs Immigrants from Dominican Republic Associate's Degree Correlation Chart
The statistical analysis conducted on geographies consisting of 355,098,353 people shows a substantial negative correlation between the proportion of Dominicans and percentage of population with at least associate's degree education in the United States with a correlation coefficient (R) of -0.530 and weighted average of 39.3%. Similarly, the statistical analysis conducted on geographies consisting of 275,132,168 people shows a moderate negative correlation between the proportion of Immigrants from Dominican Republic and percentage of population with at least associate's degree education in the United States with a correlation coefficient (R) of -0.491 and weighted average of 37.9%, a difference of 3.6%.
Associate's Degree Correlation Summary
| Measurement | Dominican | Immigrants from Dominican Republic |
| Minimum | 7.4% | 11.8% |
| Maximum | 52.8% | 49.4% |
| Range | 45.4% | 37.6% |
| Mean | 32.3% | 31.3% |
| Median | 34.0% | 30.8% |
| Interquartile 25% (IQ1) | 23.8% | 22.2% |
| Interquartile 75% (IQ3) | 41.0% | 39.7% |
| Interquartile Range (IQR) | 17.2% | 17.5% |
| Standard Deviation (Sample) | 10.0% | 9.8% |
| Standard Deviation (Population) | 10.0% | 9.7% |
Demographics Similar to Dominicans and Immigrants from Dominican Republic by Associate's Degree
In terms of associate's degree, the demographic groups most similar to Dominicans are Immigrants from Haiti (39.3%, a difference of 0.010%), Black/African American (39.1%, a difference of 0.29%), Nepalese (39.0%, a difference of 0.54%), Salvadoran (39.0%, a difference of 0.54%), and Honduran (38.9%, a difference of 0.83%). Similarly, the demographic groups most similar to Immigrants from Dominican Republic are Immigrants from Guatemala (38.1%, a difference of 0.62%), Mexican American Indian (38.2%, a difference of 0.66%), Immigrants from El Salvador (38.4%, a difference of 1.3%), Shoshone (38.4%, a difference of 1.4%), and Immigrants from Honduras (38.5%, a difference of 1.4%).
| Demographics | Rating | Rank | Associate's Degree |
| Immigrants | Haiti | 0.0 /100 | #290 | Tragic 39.3% |
| Dominicans | 0.0 /100 | #291 | Tragic 39.3% |
| Blacks/African Americans | 0.0 /100 | #292 | Tragic 39.1% |
| Nepalese | 0.0 /100 | #293 | Tragic 39.0% |
| Salvadorans | 0.0 /100 | #294 | Tragic 39.0% |
| Hondurans | 0.0 /100 | #295 | Tragic 38.9% |
| Cherokee | 0.0 /100 | #296 | Tragic 38.9% |
| Cape Verdeans | 0.0 /100 | #297 | Tragic 38.8% |
| Cheyenne | 0.0 /100 | #298 | Tragic 38.7% |
| Ute | 0.0 /100 | #299 | Tragic 38.6% |
| Chickasaw | 0.0 /100 | #300 | Tragic 38.6% |
| Tsimshian | 0.0 /100 | #301 | Tragic 38.6% |
| Colville | 0.0 /100 | #302 | Tragic 38.5% |
| Guatemalans | 0.0 /100 | #303 | Tragic 38.5% |
| Sioux | 0.0 /100 | #304 | Tragic 38.5% |
| Immigrants | Honduras | 0.0 /100 | #305 | Tragic 38.5% |
| Shoshone | 0.0 /100 | #306 | Tragic 38.4% |
| Immigrants | El Salvador | 0.0 /100 | #307 | Tragic 38.4% |
| Mexican American Indians | 0.0 /100 | #308 | Tragic 38.2% |
| Immigrants | Guatemala | 0.0 /100 | #309 | Tragic 38.1% |
| Immigrants | Dominican Republic | 0.0 /100 | #310 | Tragic 37.9% |