Japanese vs Immigrants from Dominican Republic Family Poverty
COMPARE
Japanese
Immigrants from Dominican Republic
Family Poverty
Family Poverty Comparison
Japanese
Immigrants from Dominican Republic
9.9%
FAMILY POVERTY
4.8/ 100
METRIC RATING
222nd/ 347
METRIC RANK
14.4%
FAMILY POVERTY
0.0/ 100
METRIC RATING
333rd/ 347
METRIC RANK
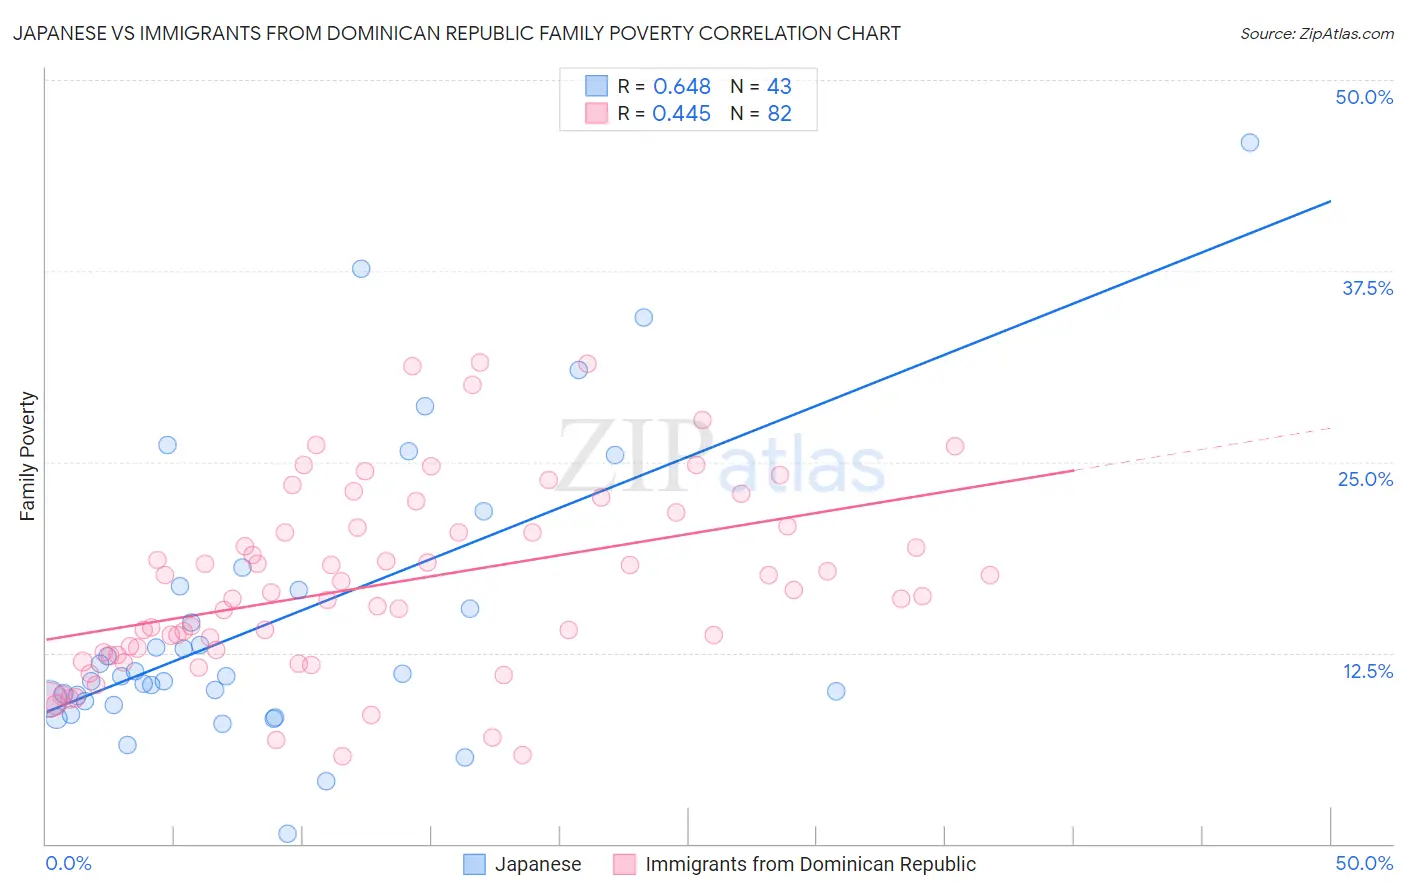
Japanese vs Immigrants from Dominican Republic Family Poverty Correlation Chart
The statistical analysis conducted on geographies consisting of 248,852,848 people shows a significant positive correlation between the proportion of Japanese and poverty level among families in the United States with a correlation coefficient (R) of 0.648 and weighted average of 9.9%. Similarly, the statistical analysis conducted on geographies consisting of 274,499,505 people shows a moderate positive correlation between the proportion of Immigrants from Dominican Republic and poverty level among families in the United States with a correlation coefficient (R) of 0.445 and weighted average of 14.4%, a difference of 46.0%.
Family Poverty Correlation Summary
| Measurement | Japanese | Immigrants from Dominican Republic |
| Minimum | 0.66% | 5.8% |
| Maximum | 45.9% | 31.5% |
| Range | 45.3% | 25.8% |
| Mean | 14.7% | 17.0% |
| Median | 11.0% | 16.3% |
| Interquartile 25% (IQ1) | 9.3% | 12.5% |
| Interquartile 75% (IQ3) | 16.8% | 20.7% |
| Interquartile Range (IQR) | 7.5% | 8.2% |
| Standard Deviation (Sample) | 9.5% | 6.1% |
| Standard Deviation (Population) | 9.4% | 6.0% |
Similar Demographics by Family Poverty
Demographics Similar to Japanese by Family Poverty
In terms of family poverty, the demographic groups most similar to Japanese are Immigrants from Cambodia (9.9%, a difference of 0.030%), Immigrants from Africa (9.9%, a difference of 0.30%), Bermudan (9.9%, a difference of 0.31%), Immigrants from Eritrea (9.9%, a difference of 0.36%), and Panamanian (9.8%, a difference of 0.49%).
| Demographics | Rating | Rank | Family Poverty |
| Immigrants | Nonimmigrants | 6.7 /100 | #215 | Tragic 9.8% |
| Moroccans | 6.5 /100 | #216 | Tragic 9.8% |
| Americans | 6.2 /100 | #217 | Tragic 9.8% |
| Panamanians | 5.6 /100 | #218 | Tragic 9.8% |
| Immigrants | Eritrea | 5.4 /100 | #219 | Tragic 9.9% |
| Bermudans | 5.3 /100 | #220 | Tragic 9.9% |
| Immigrants | Cambodia | 4.8 /100 | #221 | Tragic 9.9% |
| Japanese | 4.8 /100 | #222 | Tragic 9.9% |
| Immigrants | Africa | 4.3 /100 | #223 | Tragic 9.9% |
| Marshallese | 3.9 /100 | #224 | Tragic 9.9% |
| Immigrants | Immigrants | 3.6 /100 | #225 | Tragic 10.0% |
| Ottawa | 3.3 /100 | #226 | Tragic 10.0% |
| Immigrants | Armenia | 3.3 /100 | #227 | Tragic 10.0% |
| Sudanese | 3.1 /100 | #228 | Tragic 10.0% |
| Immigrants | Uzbekistan | 3.1 /100 | #229 | Tragic 10.0% |
Demographics Similar to Immigrants from Dominican Republic by Family Poverty
In terms of family poverty, the demographic groups most similar to Immigrants from Dominican Republic are Dominican (14.3%, a difference of 0.63%), Cheyenne (14.3%, a difference of 1.1%), Native/Alaskan (14.3%, a difference of 1.2%), Houma (14.6%, a difference of 1.3%), and Apache (14.7%, a difference of 2.1%).
| Demographics | Rating | Rank | Family Poverty |
| Colville | 0.0 /100 | #326 | Tragic 13.0% |
| Yakama | 0.0 /100 | #327 | Tragic 13.1% |
| Central American Indians | 0.0 /100 | #328 | Tragic 13.3% |
| Blacks/African Americans | 0.0 /100 | #329 | Tragic 13.3% |
| Natives/Alaskans | 0.0 /100 | #330 | Tragic 14.3% |
| Cheyenne | 0.0 /100 | #331 | Tragic 14.3% |
| Dominicans | 0.0 /100 | #332 | Tragic 14.3% |
| Immigrants | Dominican Republic | 0.0 /100 | #333 | Tragic 14.4% |
| Houma | 0.0 /100 | #334 | Tragic 14.6% |
| Apache | 0.0 /100 | #335 | Tragic 14.7% |
| Sioux | 0.0 /100 | #336 | Tragic 15.9% |
| Hopi | 0.0 /100 | #337 | Tragic 15.9% |
| Crow | 0.0 /100 | #338 | Tragic 16.1% |
| Yuman | 0.0 /100 | #339 | Tragic 16.6% |
| Pueblo | 0.0 /100 | #340 | Tragic 17.0% |