Immigrants from Iraq vs Immigrants from Dominican Republic Associate's Degree
COMPARE
Immigrants from Iraq
Immigrants from Dominican Republic
Associate's Degree
Associate's Degree Comparison
Immigrants from Iraq
Immigrants from Dominican Republic
46.4%
ASSOCIATE'S DEGREE
50.3/ 100
METRIC RATING
173rd/ 347
METRIC RANK
37.9%
ASSOCIATE'S DEGREE
0.0/ 100
METRIC RATING
310th/ 347
METRIC RANK
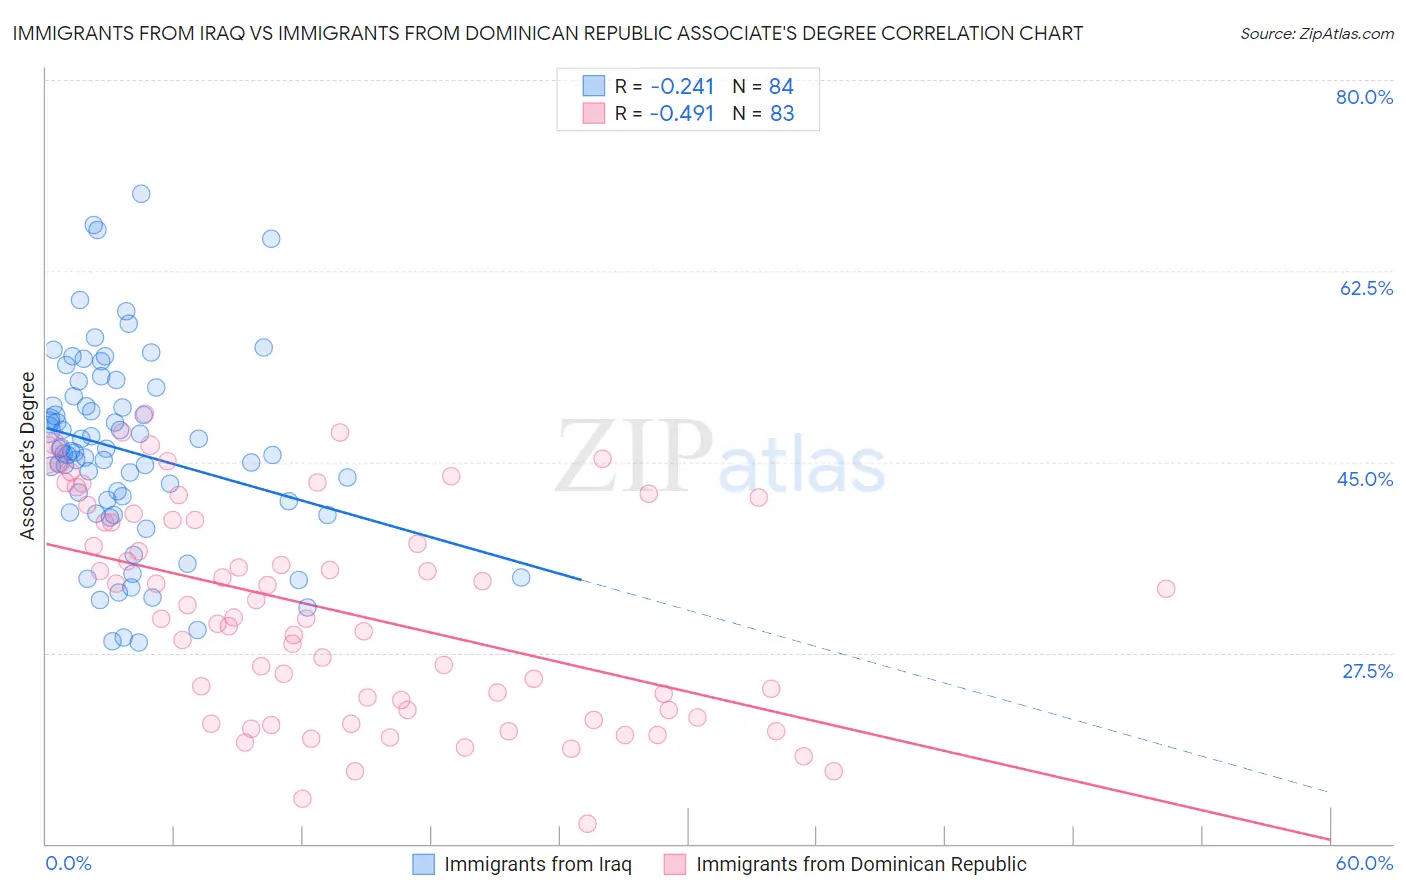
Immigrants from Iraq vs Immigrants from Dominican Republic Associate's Degree Correlation Chart
The statistical analysis conducted on geographies consisting of 194,756,177 people shows a weak negative correlation between the proportion of Immigrants from Iraq and percentage of population with at least associate's degree education in the United States with a correlation coefficient (R) of -0.241 and weighted average of 46.4%. Similarly, the statistical analysis conducted on geographies consisting of 275,132,168 people shows a moderate negative correlation between the proportion of Immigrants from Dominican Republic and percentage of population with at least associate's degree education in the United States with a correlation coefficient (R) of -0.491 and weighted average of 37.9%, a difference of 22.3%.
Associate's Degree Correlation Summary
| Measurement | Immigrants from Iraq | Immigrants from Dominican Republic |
| Minimum | 28.4% | 11.8% |
| Maximum | 69.6% | 49.4% |
| Range | 41.2% | 37.6% |
| Mean | 46.0% | 31.3% |
| Median | 46.0% | 30.8% |
| Interquartile 25% (IQ1) | 40.9% | 22.2% |
| Interquartile 75% (IQ3) | 50.6% | 39.7% |
| Interquartile Range (IQR) | 9.7% | 17.5% |
| Standard Deviation (Sample) | 8.8% | 9.8% |
| Standard Deviation (Population) | 8.8% | 9.7% |
Similar Demographics by Associate's Degree
Demographics Similar to Immigrants from Iraq by Associate's Degree
In terms of associate's degree, the demographic groups most similar to Immigrants from Iraq are Peruvian (46.4%, a difference of 0.020%), English (46.4%, a difference of 0.020%), Belgian (46.3%, a difference of 0.10%), Finnish (46.3%, a difference of 0.13%), and Slovak (46.3%, a difference of 0.14%).
| Demographics | Rating | Rank | Associate's Degree |
| Hungarians | 59.3 /100 | #166 | Average 46.7% |
| Immigrants | Sierra Leone | 59.2 /100 | #167 | Average 46.7% |
| Immigrants | Somalia | 55.5 /100 | #168 | Average 46.5% |
| Uruguayans | 55.4 /100 | #169 | Average 46.5% |
| Irish | 53.6 /100 | #170 | Average 46.5% |
| Basques | 52.8 /100 | #171 | Average 46.5% |
| Peruvians | 50.5 /100 | #172 | Average 46.4% |
| Immigrants | Iraq | 50.3 /100 | #173 | Average 46.4% |
| English | 50.0 /100 | #174 | Average 46.4% |
| Belgians | 48.9 /100 | #175 | Average 46.3% |
| Finns | 48.5 /100 | #176 | Average 46.3% |
| Slovaks | 48.4 /100 | #177 | Average 46.3% |
| Immigrants | Bosnia and Herzegovina | 48.3 /100 | #178 | Average 46.3% |
| Sri Lankans | 47.6 /100 | #179 | Average 46.3% |
| Bermudans | 46.4 /100 | #180 | Average 46.2% |
Demographics Similar to Immigrants from Dominican Republic by Associate's Degree
In terms of associate's degree, the demographic groups most similar to Immigrants from Dominican Republic are Immigrants from Latin America (37.9%, a difference of 0.11%), Choctaw (37.8%, a difference of 0.33%), Hispanic or Latino (37.7%, a difference of 0.48%), Seminole (37.7%, a difference of 0.53%), and Immigrants from Guatemala (38.1%, a difference of 0.62%).
| Demographics | Rating | Rank | Associate's Degree |
| Guatemalans | 0.0 /100 | #303 | Tragic 38.5% |
| Sioux | 0.0 /100 | #304 | Tragic 38.5% |
| Immigrants | Honduras | 0.0 /100 | #305 | Tragic 38.5% |
| Shoshone | 0.0 /100 | #306 | Tragic 38.4% |
| Immigrants | El Salvador | 0.0 /100 | #307 | Tragic 38.4% |
| Mexican American Indians | 0.0 /100 | #308 | Tragic 38.2% |
| Immigrants | Guatemala | 0.0 /100 | #309 | Tragic 38.1% |
| Immigrants | Dominican Republic | 0.0 /100 | #310 | Tragic 37.9% |
| Immigrants | Latin America | 0.0 /100 | #311 | Tragic 37.9% |
| Choctaw | 0.0 /100 | #312 | Tragic 37.8% |
| Hispanics or Latinos | 0.0 /100 | #313 | Tragic 37.7% |
| Seminole | 0.0 /100 | #314 | Tragic 37.7% |
| Creek | 0.0 /100 | #315 | Tragic 37.6% |
| Crow | 0.0 /100 | #316 | Tragic 37.6% |
| Yaqui | 0.0 /100 | #317 | Tragic 37.6% |