Japanese vs Immigrants from Pakistan Associate's Degree
COMPARE
Japanese
Immigrants from Pakistan
Associate's Degree
Associate's Degree Comparison
Japanese
Immigrants from Pakistan
41.7%
ASSOCIATE'S DEGREE
0.5/ 100
METRIC RATING
258th/ 347
METRIC RANK
50.9%
ASSOCIATE'S DEGREE
99.5/ 100
METRIC RATING
72nd/ 347
METRIC RANK
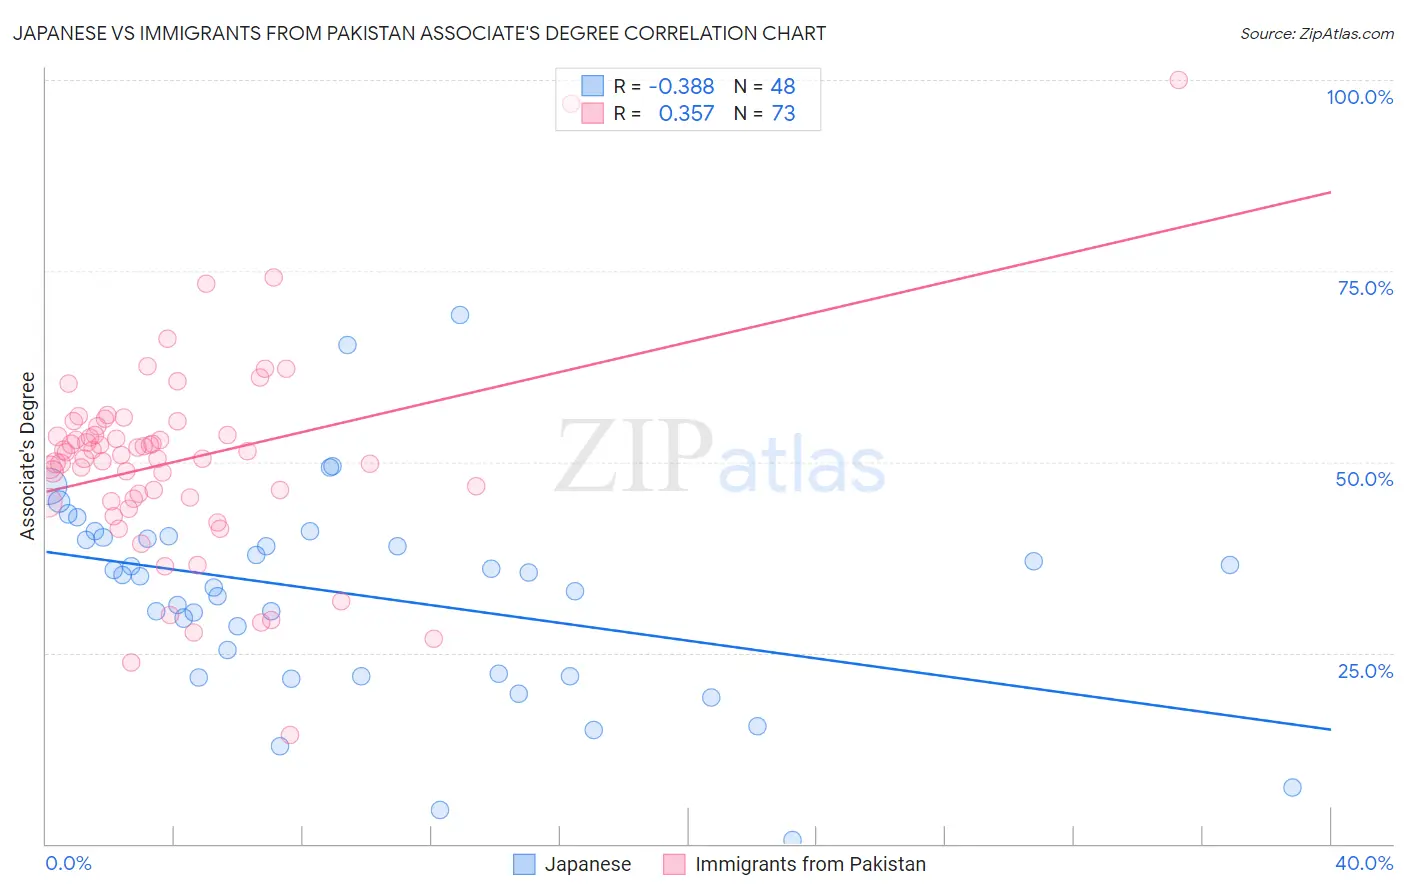
Japanese vs Immigrants from Pakistan Associate's Degree Correlation Chart
The statistical analysis conducted on geographies consisting of 249,174,886 people shows a mild negative correlation between the proportion of Japanese and percentage of population with at least associate's degree education in the United States with a correlation coefficient (R) of -0.388 and weighted average of 41.7%. Similarly, the statistical analysis conducted on geographies consisting of 283,905,893 people shows a mild positive correlation between the proportion of Immigrants from Pakistan and percentage of population with at least associate's degree education in the United States with a correlation coefficient (R) of 0.357 and weighted average of 50.9%, a difference of 22.1%.
Associate's Degree Correlation Summary
| Measurement | Japanese | Immigrants from Pakistan |
| Minimum | 0.50% | 14.3% |
| Maximum | 69.2% | 100.0% |
| Range | 68.7% | 85.7% |
| Mean | 32.6% | 50.1% |
| Median | 35.1% | 50.9% |
| Interquartile 25% (IQ1) | 22.1% | 45.0% |
| Interquartile 75% (IQ3) | 40.0% | 54.1% |
| Interquartile Range (IQR) | 17.9% | 9.2% |
| Standard Deviation (Sample) | 13.5% | 13.3% |
| Standard Deviation (Population) | 13.4% | 13.2% |
Similar Demographics by Associate's Degree
Demographics Similar to Japanese by Associate's Degree
In terms of associate's degree, the demographic groups most similar to Japanese are Malaysian (41.6%, a difference of 0.10%), Spanish American (41.8%, a difference of 0.22%), Immigrants from Congo (41.8%, a difference of 0.27%), Marshallese (41.6%, a difference of 0.30%), and Immigrants from Guyana (41.8%, a difference of 0.40%).
| Demographics | Rating | Rank | Associate's Degree |
| Immigrants | Bahamas | 0.7 /100 | #251 | Tragic 42.1% |
| French American Indians | 0.6 /100 | #252 | Tragic 42.0% |
| Indonesians | 0.6 /100 | #253 | Tragic 41.9% |
| Cubans | 0.6 /100 | #254 | Tragic 41.9% |
| Immigrants | Guyana | 0.5 /100 | #255 | Tragic 41.8% |
| Immigrants | Congo | 0.5 /100 | #256 | Tragic 41.8% |
| Spanish Americans | 0.5 /100 | #257 | Tragic 41.8% |
| Japanese | 0.5 /100 | #258 | Tragic 41.7% |
| Malaysians | 0.4 /100 | #259 | Tragic 41.6% |
| Marshallese | 0.4 /100 | #260 | Tragic 41.6% |
| Nicaraguans | 0.4 /100 | #261 | Tragic 41.5% |
| Bahamians | 0.4 /100 | #262 | Tragic 41.5% |
| Immigrants | Jamaica | 0.3 /100 | #263 | Tragic 41.5% |
| Osage | 0.3 /100 | #264 | Tragic 41.5% |
| Africans | 0.2 /100 | #265 | Tragic 41.1% |
Demographics Similar to Immigrants from Pakistan by Associate's Degree
In terms of associate's degree, the demographic groups most similar to Immigrants from Pakistan are Immigrants from Romania (50.9%, a difference of 0.060%), Immigrants from Argentina (50.9%, a difference of 0.070%), Egyptian (50.9%, a difference of 0.10%), Immigrants from Indonesia (51.0%, a difference of 0.22%), and Carpatho Rusyn (50.6%, a difference of 0.46%).
| Demographics | Rating | Rank | Associate's Degree |
| Zimbabweans | 99.7 /100 | #65 | Exceptional 51.3% |
| Immigrants | Europe | 99.7 /100 | #66 | Exceptional 51.3% |
| Argentineans | 99.6 /100 | #67 | Exceptional 51.2% |
| Immigrants | Indonesia | 99.5 /100 | #68 | Exceptional 51.0% |
| Egyptians | 99.5 /100 | #69 | Exceptional 50.9% |
| Immigrants | Argentina | 99.5 /100 | #70 | Exceptional 50.9% |
| Immigrants | Romania | 99.5 /100 | #71 | Exceptional 50.9% |
| Immigrants | Pakistan | 99.5 /100 | #72 | Exceptional 50.9% |
| Carpatho Rusyns | 99.3 /100 | #73 | Exceptional 50.6% |
| Lithuanians | 99.3 /100 | #74 | Exceptional 50.6% |
| Immigrants | Scotland | 99.3 /100 | #75 | Exceptional 50.6% |
| Immigrants | Zimbabwe | 99.2 /100 | #76 | Exceptional 50.5% |
| Immigrants | Lebanon | 99.1 /100 | #77 | Exceptional 50.5% |
| Immigrants | Eastern Europe | 99.1 /100 | #78 | Exceptional 50.5% |
| Ethiopians | 99.1 /100 | #79 | Exceptional 50.4% |