Japanese vs Samoan Associate's Degree
COMPARE
Japanese
Samoan
Associate's Degree
Associate's Degree Comparison
Japanese
Samoans
41.7%
ASSOCIATE'S DEGREE
0.5/ 100
METRIC RATING
258th/ 347
METRIC RANK
41.1%
ASSOCIATE'S DEGREE
0.2/ 100
METRIC RATING
266th/ 347
METRIC RANK
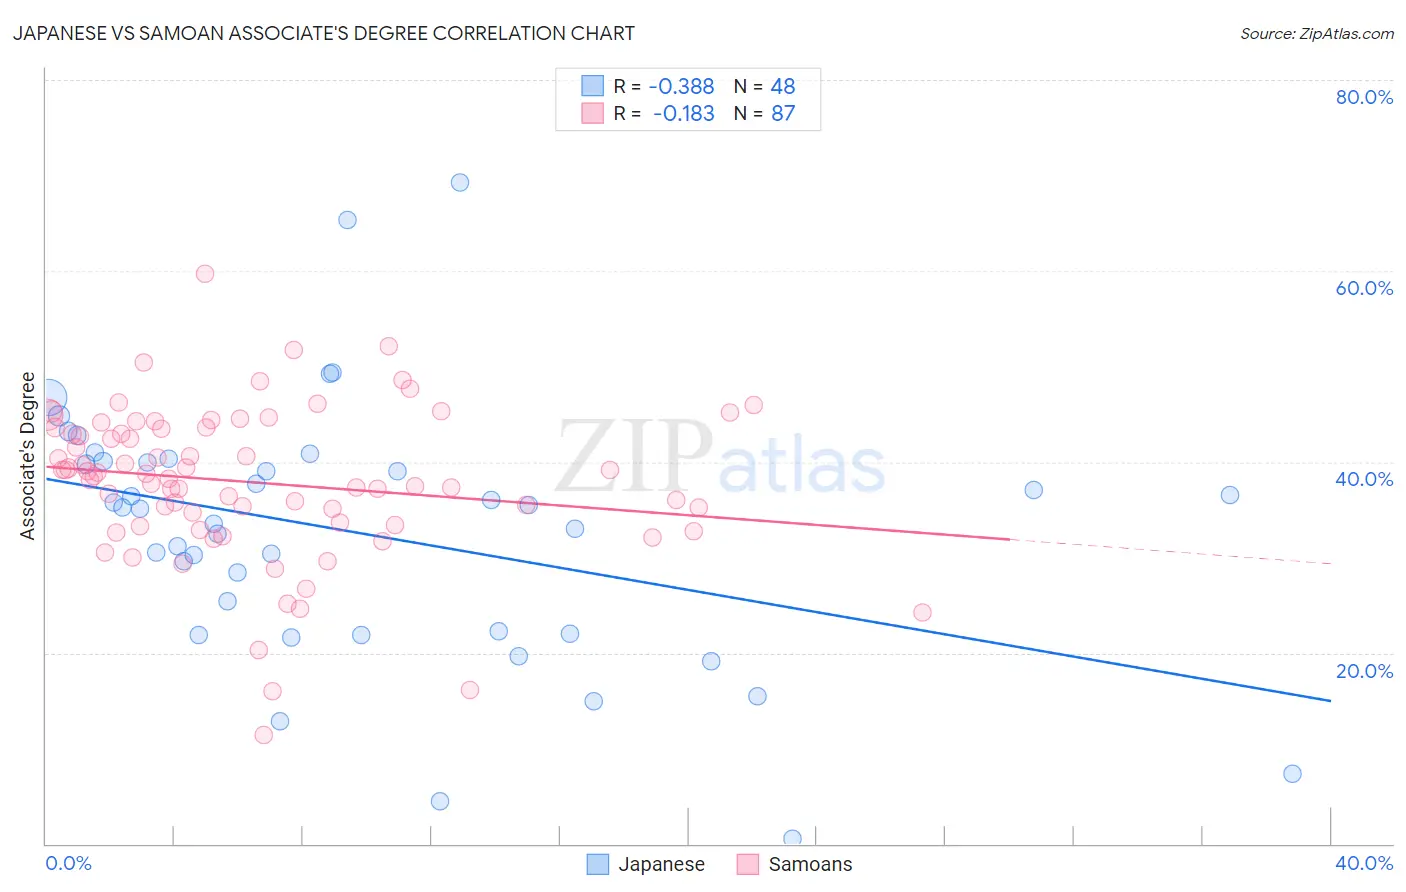
Japanese vs Samoan Associate's Degree Correlation Chart
The statistical analysis conducted on geographies consisting of 249,174,886 people shows a mild negative correlation between the proportion of Japanese and percentage of population with at least associate's degree education in the United States with a correlation coefficient (R) of -0.388 and weighted average of 41.7%. Similarly, the statistical analysis conducted on geographies consisting of 225,200,067 people shows a poor negative correlation between the proportion of Samoans and percentage of population with at least associate's degree education in the United States with a correlation coefficient (R) of -0.183 and weighted average of 41.1%, a difference of 1.3%.
Associate's Degree Correlation Summary
| Measurement | Japanese | Samoan |
| Minimum | 0.50% | 11.4% |
| Maximum | 69.2% | 59.7% |
| Range | 68.7% | 48.3% |
| Mean | 32.6% | 37.8% |
| Median | 35.1% | 38.5% |
| Interquartile 25% (IQ1) | 22.1% | 33.3% |
| Interquartile 75% (IQ3) | 40.0% | 43.6% |
| Interquartile Range (IQR) | 17.9% | 10.3% |
| Standard Deviation (Sample) | 13.5% | 8.1% |
| Standard Deviation (Population) | 13.4% | 8.0% |
Demographics Similar to Japanese and Samoans by Associate's Degree
In terms of associate's degree, the demographic groups most similar to Japanese are Malaysian (41.6%, a difference of 0.10%), Spanish American (41.8%, a difference of 0.22%), Immigrants from Congo (41.8%, a difference of 0.27%), Marshallese (41.6%, a difference of 0.30%), and Immigrants from Guyana (41.8%, a difference of 0.40%). Similarly, the demographic groups most similar to Samoans are African (41.1%, a difference of 0.0%), Hawaiian (40.9%, a difference of 0.56%), Osage (41.5%, a difference of 0.76%), Central American Indian (40.8%, a difference of 0.76%), and Immigrants from Jamaica (41.5%, a difference of 0.77%).
| Demographics | Rating | Rank | Associate's Degree |
| French American Indians | 0.6 /100 | #252 | Tragic 42.0% |
| Indonesians | 0.6 /100 | #253 | Tragic 41.9% |
| Cubans | 0.6 /100 | #254 | Tragic 41.9% |
| Immigrants | Guyana | 0.5 /100 | #255 | Tragic 41.8% |
| Immigrants | Congo | 0.5 /100 | #256 | Tragic 41.8% |
| Spanish Americans | 0.5 /100 | #257 | Tragic 41.8% |
| Japanese | 0.5 /100 | #258 | Tragic 41.7% |
| Malaysians | 0.4 /100 | #259 | Tragic 41.6% |
| Marshallese | 0.4 /100 | #260 | Tragic 41.6% |
| Nicaraguans | 0.4 /100 | #261 | Tragic 41.5% |
| Bahamians | 0.4 /100 | #262 | Tragic 41.5% |
| Immigrants | Jamaica | 0.3 /100 | #263 | Tragic 41.5% |
| Osage | 0.3 /100 | #264 | Tragic 41.5% |
| Africans | 0.2 /100 | #265 | Tragic 41.1% |
| Samoans | 0.2 /100 | #266 | Tragic 41.1% |
| Hawaiians | 0.2 /100 | #267 | Tragic 40.9% |
| Central American Indians | 0.2 /100 | #268 | Tragic 40.8% |
| Americans | 0.2 /100 | #269 | Tragic 40.8% |
| Chippewa | 0.2 /100 | #270 | Tragic 40.7% |
| Immigrants | Laos | 0.1 /100 | #271 | Tragic 40.7% |
| Belizeans | 0.1 /100 | #272 | Tragic 40.6% |