Japanese vs Immigrants from England Associate's Degree
COMPARE
Japanese
Immigrants from England
Associate's Degree
Associate's Degree Comparison
Japanese
Immigrants from England
41.7%
ASSOCIATE'S DEGREE
0.5/ 100
METRIC RATING
258th/ 347
METRIC RANK
49.7%
ASSOCIATE'S DEGREE
98.0/ 100
METRIC RATING
95th/ 347
METRIC RANK
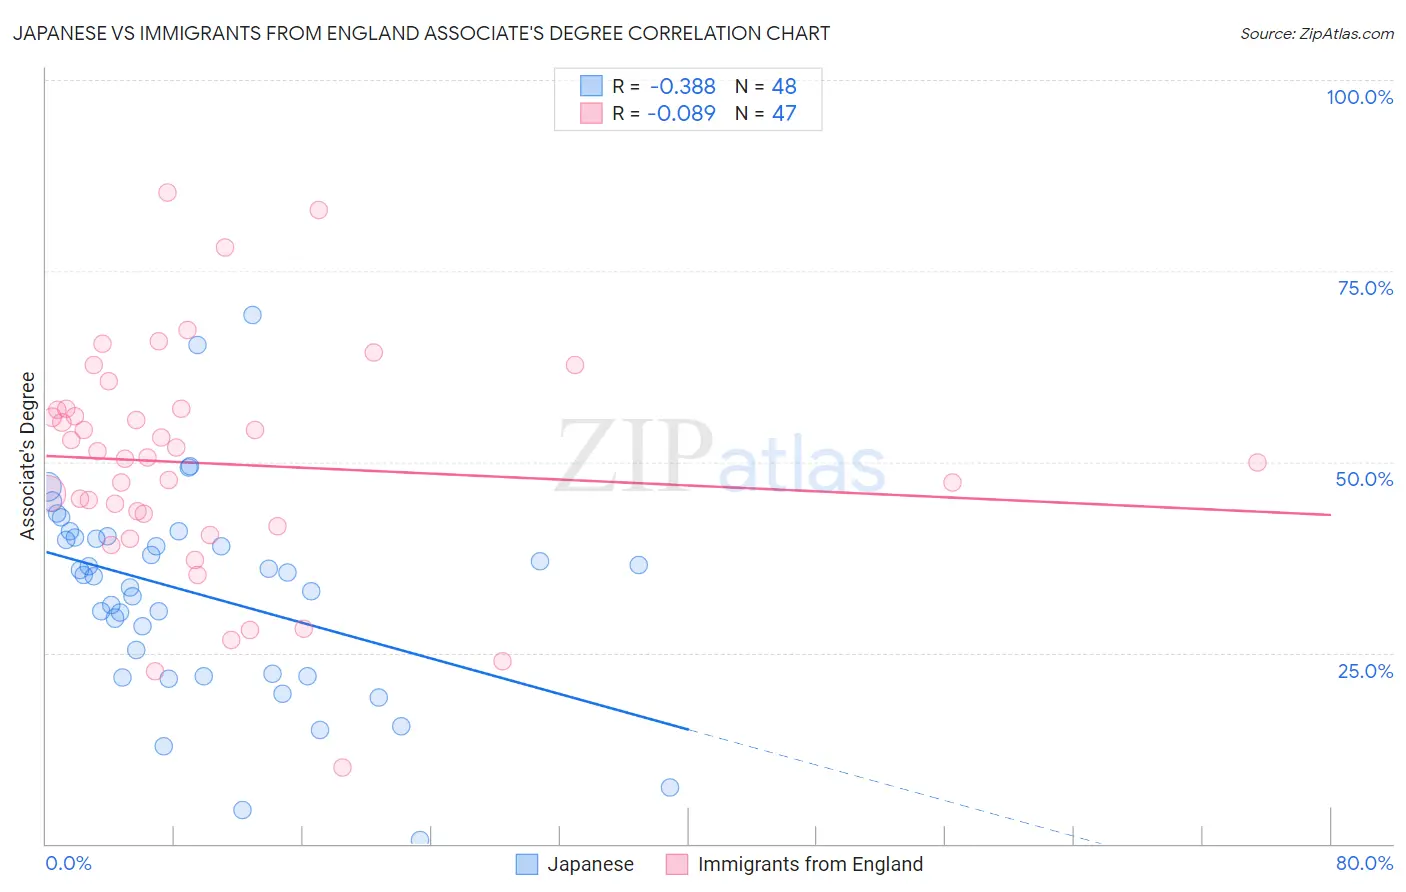
Japanese vs Immigrants from England Associate's Degree Correlation Chart
The statistical analysis conducted on geographies consisting of 249,174,886 people shows a mild negative correlation between the proportion of Japanese and percentage of population with at least associate's degree education in the United States with a correlation coefficient (R) of -0.388 and weighted average of 41.7%. Similarly, the statistical analysis conducted on geographies consisting of 391,885,412 people shows a slight negative correlation between the proportion of Immigrants from England and percentage of population with at least associate's degree education in the United States with a correlation coefficient (R) of -0.089 and weighted average of 49.7%, a difference of 19.3%.
Associate's Degree Correlation Summary
| Measurement | Japanese | Immigrants from England |
| Minimum | 0.50% | 10.0% |
| Maximum | 69.2% | 85.3% |
| Range | 68.7% | 75.3% |
| Mean | 32.6% | 49.8% |
| Median | 35.1% | 50.6% |
| Interquartile 25% (IQ1) | 22.1% | 41.6% |
| Interquartile 75% (IQ3) | 40.0% | 56.9% |
| Interquartile Range (IQR) | 17.9% | 15.3% |
| Standard Deviation (Sample) | 13.5% | 15.0% |
| Standard Deviation (Population) | 13.4% | 14.9% |
Similar Demographics by Associate's Degree
Demographics Similar to Japanese by Associate's Degree
In terms of associate's degree, the demographic groups most similar to Japanese are Malaysian (41.6%, a difference of 0.10%), Spanish American (41.8%, a difference of 0.22%), Immigrants from Congo (41.8%, a difference of 0.27%), Marshallese (41.6%, a difference of 0.30%), and Immigrants from Guyana (41.8%, a difference of 0.40%).
| Demographics | Rating | Rank | Associate's Degree |
| Immigrants | Bahamas | 0.7 /100 | #251 | Tragic 42.1% |
| French American Indians | 0.6 /100 | #252 | Tragic 42.0% |
| Indonesians | 0.6 /100 | #253 | Tragic 41.9% |
| Cubans | 0.6 /100 | #254 | Tragic 41.9% |
| Immigrants | Guyana | 0.5 /100 | #255 | Tragic 41.8% |
| Immigrants | Congo | 0.5 /100 | #256 | Tragic 41.8% |
| Spanish Americans | 0.5 /100 | #257 | Tragic 41.8% |
| Japanese | 0.5 /100 | #258 | Tragic 41.7% |
| Malaysians | 0.4 /100 | #259 | Tragic 41.6% |
| Marshallese | 0.4 /100 | #260 | Tragic 41.6% |
| Nicaraguans | 0.4 /100 | #261 | Tragic 41.5% |
| Bahamians | 0.4 /100 | #262 | Tragic 41.5% |
| Immigrants | Jamaica | 0.3 /100 | #263 | Tragic 41.5% |
| Osage | 0.3 /100 | #264 | Tragic 41.5% |
| Africans | 0.2 /100 | #265 | Tragic 41.1% |
Demographics Similar to Immigrants from England by Associate's Degree
In terms of associate's degree, the demographic groups most similar to Immigrants from England are Romanian (49.7%, a difference of 0.010%), Immigrants from Ukraine (49.7%, a difference of 0.020%), Immigrants from Northern Africa (49.7%, a difference of 0.11%), Macedonian (49.6%, a difference of 0.18%), and Laotian (49.9%, a difference of 0.39%).
| Demographics | Rating | Rank | Associate's Degree |
| Immigrants | Canada | 98.7 /100 | #88 | Exceptional 50.1% |
| Immigrants | Western Europe | 98.7 /100 | #89 | Exceptional 50.1% |
| Immigrants | Ethiopia | 98.7 /100 | #90 | Exceptional 50.1% |
| Immigrants | Western Asia | 98.7 /100 | #91 | Exceptional 50.1% |
| Immigrants | North America | 98.7 /100 | #92 | Exceptional 50.1% |
| Immigrants | Brazil | 98.5 /100 | #93 | Exceptional 50.0% |
| Laotians | 98.4 /100 | #94 | Exceptional 49.9% |
| Immigrants | England | 98.0 /100 | #95 | Exceptional 49.7% |
| Romanians | 98.0 /100 | #96 | Exceptional 49.7% |
| Immigrants | Ukraine | 98.0 /100 | #97 | Exceptional 49.7% |
| Immigrants | Northern Africa | 97.9 /100 | #98 | Exceptional 49.7% |
| Macedonians | 97.8 /100 | #99 | Exceptional 49.6% |
| Immigrants | Nepal | 97.5 /100 | #100 | Exceptional 49.5% |
| Northern Europeans | 97.3 /100 | #101 | Exceptional 49.5% |
| Chileans | 97.3 /100 | #102 | Exceptional 49.4% |